Motor Vehicle Deaths in Japan, 2020
National Police Agency reported that 2839 people were killed by car accidents in 2020. Those were the victims only who died within 24 hours after the accidents. The number of actual victims is more than them.
The number of victims decreased by 376 from 2019.
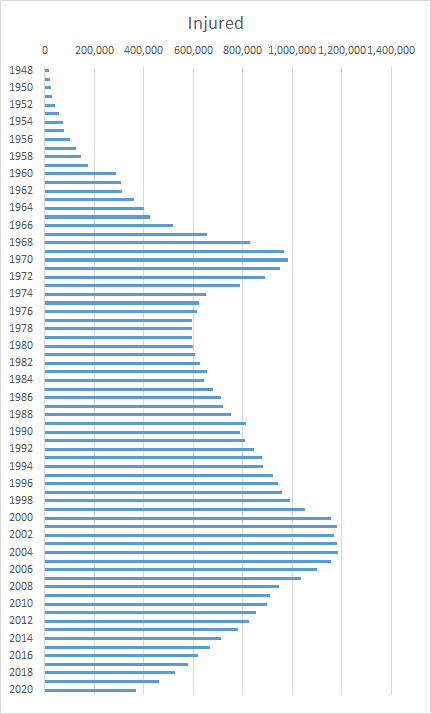
Table: Number of Motor Vehicle Deaths 1948-2020
| Year | Accidents | Injured | Deaths | Deaths per 100,000 |
| 1948 | 21,341 | 17,609 | 3,848 | 4.93 |
| 1949 | 25,113 | 20,242 | 3,790 | 4.74 |
| 1950 | 33,212 | 25,450 | 4,202 | 5.14 |
| 1951 | 41,423 | 31,274 | 4,429 | 5.32 |
| 1952 | 58,487 | 43,321 | 4,696 | 5.55 |
| 1953 | 80,019 | 59,280 | 5,544 | 6.46 |
| 1954 | 93,869 | 72,390 | 6,374 | 7.32 |
| 1955 | 93,981 | 76,501 | 6,379 | 7.22 |
| 1956 | 122,691 | 102,072 | 6,751 | 7.56 |
| 1957 | 146,833 | 124,530 | 7,575 | 8.39 |
| 1958 | 168,799 | 145,432 | 8,248 | 9.05 |
| 1959 | 201,292 | 175,951 | 10,079 | 10.95 |
| 1960 | 449,917 | 289,156 | 12,055 | 12.97 |
| 1961 | 493,693 | 308,697 | 12,865 | 13.77 |
| 1962 | 479,825 | 313,813 | 11,445 | 12.14 |
| 1963 | 531,966 | 359,089 | 12,301 | 12.92 |
| 1964 | 557,183 | 401,117 | 13,318 | 13.85 |
| 1965 | 567,286 | 425,666 | 12,484 | 12.85 |
| 1966 | 425,944 | 517,775 | 13,904 | 14.15 |
| 1967 | 521,481 | 655,377 | 13,618 | 13.75 |
| 1968 | 635,056 | 828,071 | 14,256 | 14.22 |
| 1969 | 720,880 | 967,000 | 16,257 | 16.03 |
| 1970 | 718,080 | 981,096 | 16,765 | 16.33 |
| 1971 | 700,290 | 949,689 | 16,278 | 15.69 |
| 1972 | 659,283 | 889,198 | 15,918 | 15.16 |
| 1973 | 586,713 | 789,948 | 14,574 | 13.58 |
| 1974 | 490,452 | 651,420 | 11,432 | 10.52 |
| 1975 | 472,938 | 622,467 | 10,792 | 9.81 |
| 1976 | 471,041 | 613,957 | 9,734 | 8.70 |
| 1977 | 460,649 | 593,211 | 8,945 | 7.91 |
| 1978 | 464,037 | 594,116 | 8,783 | 7.69 |
| 1979 | 471,573 | 596,282 | 8,466 | 7.35 |
| 1980 | 476,677 | 598,719 | 8,760 | 7.54 |
| 1981 | 485,578 | 607,346 | 8,719 | 7.45 |
| 1982 | 502,261 | 626,192 | 9,073 | 7.70 |
| 1983 | 526,362 | 654,822 | 9,520 | 8.02 |
| 1984 | 518,642 | 644,321 | 9,262 | 7.75 |
| 1985 | 552,788 | 681,346 | 9,261 | 7.70 |
| 1986 | 579,190 | 712,330 | 9,317 | 7.70 |
| 1987 | 590,723 | 722,179 | 9,347 | 7.68 |
| 1988 | 614,481 | 752,845 | 10,344 | 8.46 |
| 1989 | 661,363 | 814,832 | 11,086 | 9.03 |
| 1990 | 643,097 | 790,295 | 11,227 | 9.11 |
| 1991 | 662,392 | 810,245 | 11,109 | 8.99 |
| 1992 | 695,346 | 844,003 | 11,452 | 9.23 |
| 1993 | 724,678 | 878,633 | 10,945 | 8.79 |
| 1994 | 729,461 | 881,723 | 10,653 | 8.54 |
| 1995 | 761,794 | 922,677 | 10,684 | 8.54 |
| 1996 | 771,085 | 942,204 | 9,943 | 7.92 |
| 1997 | 780,401 | 958,925 | 9,642 | 7.66 |
| 1998 | 803,882 | 990,676 | 9,214 | 7.30 |
| 1999 | 850,371 | 1,050,399 | 9,012 | 7.12 |
| 2000 | 931,950 | 1,155,707 | 9,073 | 7.16 |
| 2001 | 947,253 | 1,181,039 | 8,757 | 6.90 |
| 2002 | 936,950 | 1,168,029 | 8,396 | 6.60 |
| 2003 | 948,281 | 1,181,681 | 7,768 | 6.10 |
| 2004 | 952,720 | 1,183,617 | 7,436 | 5.83 |
| 2005 | 934,346 | 1,157,113 | 6,937 | 5.43 |
| 2006 | 887,267 | 1,098,564 | 6,415 | 5.02 |
| 2007 | 832,704 | 1,034,652 | 5,796 | 4.54 |
| 2008 | 766,394 | 945,703 | 5,209 | 4.08 |
| 2009 | 737,637 | 911,215 | 4,979 | 3.90 |
| 2010 | 725,924 | 896,297 | 4,948 | 3.88 |
| 2011 | 692,084 | 854,613 | 4,691 | 3.66 |
| 2012 | 665,157 | 825,392 | 4,438 | 3.47 |
| 2013 | 629,033 | 781,492 | 4,388 | 3.44 |
| 2014 | 573,842 | 711,374 | 4,113 | 3.23 |
| 2015 | 536,899 | 666,023 | 4,117 | 3.24 |
| 2016 | 499,201 | 618,853 | 3,904 | 3.07 |
| 2017 | 472,165 | 580,850 | 3,694 | 2.91 |
| 2018 | 430,601 | 525,846 | 3,532 | 2.79 |
| 2019 | 381,002 | 460,715 | 3,215 | 2.54 |
| 2020 | 309,000 | 368,601 | 2,839 | 2.25 |

Source is National Police Agency. 交通事故統計、年報、交通事故死者数について
www.npa.go.jp/publications/statistics/koutsuu/toukeihyo.html
Related Topics