There are 4874 senior high schools in Japan in 2020, according to the statistics of the Ministry of Education, Culture, Sports, Science and Technology.
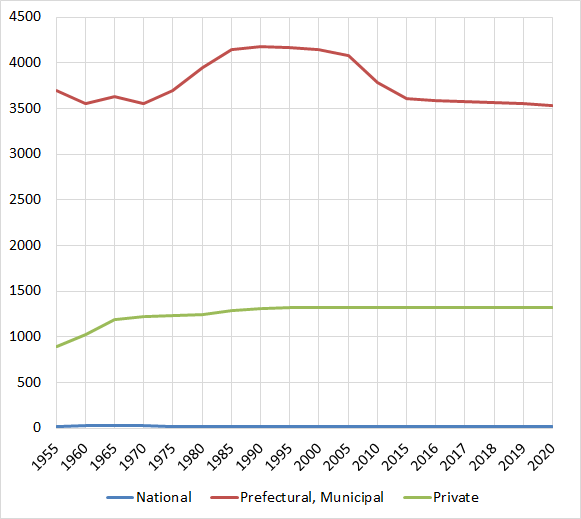
The following shows the evolution of the number of senior high schools between 1955 and 2020.
Table 1: Number of senior high schools, 1955-2020.
| Total | National | Prefectural, Municipal | Private | Percentage of private school (%) | |
| 1955 | 4,607 | 21 | 3,691 | 895 | 19.4 |
| 1960 | 4,598 | 23 | 3,554 | 1,021 | 22.2 |
| 1965 | 4,849 | 24 | 3,633 | 1,192 | 24.6 |
| 1970 | 4,798 | 24 | 3,550 | 1,224 | 25.5 |
| 1975 | 4,946 | 17 | 3,701 | 1,228 | 24.8 |
| 1980 | 5,208 | 17 | 3,951 | 1,240 | 23.8 |
| 1985 | 5,453 | 17 | 4,147 | 1,289 | 23.6 |
| 1990 | 5,506 | 17 | 4,177 | 1,312 | 23.8 |
| 1995 | 5,501 | 17 | 4,164 | 1,320 | 24.0 |
| 2000 | 5,478 | 15 | 4,145 | 1,318 | 24.1 |
| 2005 | 5,418 | 15 | 4,082 | 1,321 | 24.4 |
| 2010 | 5,116 | 15 | 3,780 | 1,321 | 25.8 |
| 2015 | 4,939 | 15 | 3,604 | 1,320 | 26.7 |
| 2016 | 4,925 | 15 | 3,589 | 1,321 | 26.8 |
| 2017 | 4,907 | 15 | 3,571 | 1,321 | 26.9 |
| 2018 | 4,897 | 15 | 3,559 | 1,323 | 27.0 |
| 2019 | 4,887 | 15 | 3,550 | 1,322 | 27.1 |
| 2020 | 4,874 | 15 | 3,537 | 1,322 | 27.1 |
Figure: Number of senior high schools, 1955-2020.

In addition to general senior high schools, there are colleges of technology and secondary schools in Japan for students aged 15 to 18 to attend.
College of technology is a five-year course that is mainly attended by students aged 15 to 20 after graduating from junior high school.
Secondary school is a combination of junior high school and senior high school, and is attended by students aged 12 to 18.
The next data shows the changes in the number of colleges of technology and secondary schools in Japan between 1962 and 2020.
Table 2: Number of colleges of technology, 1955-2020.
| Total | National | Prefectural, Municipal | Private | |
| 1962 | 19 | 12 | 2 | 5 |
| 1965 | 54 | 43 | 4 | 7 |
| 1970 | 60 | 49 | 4 | 7 |
| 1975 | 65 | 54 | 4 | 7 |
| 1980 | 62 | 54 | 4 | 4 |
| 1985 | 62 | 54 | 4 | 4 |
| 1990 | 62 | 54 | 4 | 4 |
| 1995 | 62 | 54 | 5 | 3 |
| 2000 | 63 | 54 | 5 | 3 |
| 2005 | 63 | 55 | 5 | 3 |
| 2010 | 58 | 51 | 4 | 3 |
| 2015 | 57 | 51 | 3 | 3 |
| 2016 | 57 | 51 | 3 | 3 |
| 2017 | 57 | 51 | 3 | 3 |
| 2018 | 57 | 51 | 3 | 3 |
| 2019 | 57 | 51 | 3 | 3 |
| 2020 | 57 | 51 | 3 | 3 |
Table 3: Number of secondary schools, 1955-2020.
| Total | National | Prefectural, Municipal | Private | Percentage of private school (%) | |
| 1999 | 1 | - | 1 | - | - |
| 2000 | 4 | 2 | 1 | 1 | 25.0 |
| 2005 | 19 | 2 | 8 | 9 | 47.4 |
| 2010 | 48 | 4 | 28 | 16 | 33.3 |
| 2015 | 52 | 4 | 31 | 17 | 32.7 |
| 2016 | 52 | 4 | 31 | 17 | 32.7 |
| 2017 | 53 | 4 | 31 | 18 | 34.0 |
| 2018 | 53 | 4 | 31 | 18 | 34.0 |
| 2019 | 54 | 4 | 32 | 18 | 33.3 |
| 2020 | 56 | 4 | 33 | 19 | 33.9 |
Source is Ministry of Education, Culture, Sports, Science and Technology. 文部科学統計要覧(令和3年版)
www.mext.go.jp/b_menu/toukei/002/002b/1417059_00006.htm
Related Topics