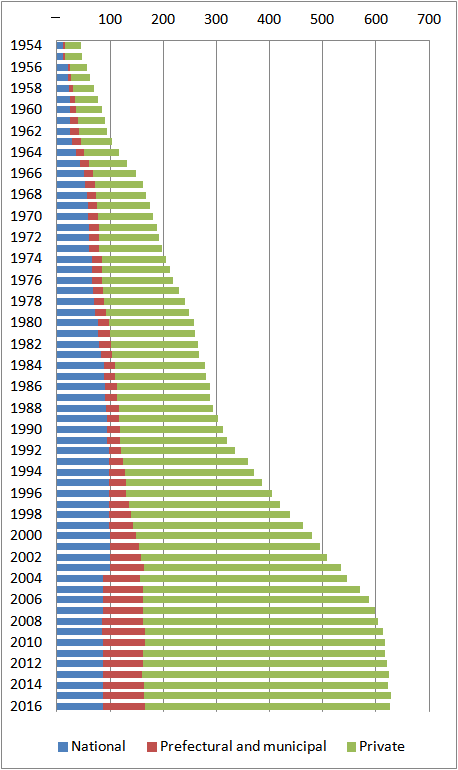
Changes in the Number of Postgraduate Colleges in Japan, 1954-2016
The following data show the changes in the number of postgraduate colleges in Japan between 1954 and 2016. Since 1980s, the numbers of national schools have not changed much. On the other hand, the numbers of private schools are increasing.
Figure: Changes in the Number of Postgraduate Colleges in Japan by Administrative Organization

| Year | National | Prefectural and municipal | Private |
| 1954 | 12 | 4 | 30 |
| 1955 | 12 | 4 | 31 |
| 1956 | 21 | 4 | 31 |
| 1957 | 21 | 6 | 35 |
| 1958 | 23 | 7 | 39 |
| 1959 | 25 | 9 | 44 |
| 1960 | 25 | 11 | 48 |
| 1961 | 25 | 15 | 51 |
| 1962 | 25 | 16 | 54 |
| 1963 | 29 | 16 | 58 |
| 1964 | 35 | 16 | 65 |
| 1965 | 43 | 17 | 71 |
| 1966 | 50 | 18 | 81 |
| 1967 | 53 | 19 | 90 |
| 1968 | 57 | 17 | 93 |
| 1969 | 58 | 17 | 100 |
| 1970 | 59 | 19 | 102 |
| 1971 | 61 | 19 | 108 |
| 1972 | 61 | 19 | 112 |
| 1973 | 61 | 19 | 117 |
| 1974 | 65 | 19 | 121 |
| 1975 | 66 | 18 | 129 |
| 1976 | 66 | 18 | 134 |
| 1977 | 67 | 19 | 144 |
| 1978 | 69 | 19 | 152 |
| 1979 | 72 | 20 | 157 |
| 1980 | 77 | 21 | 159 |
| 1981 | 78 | 22 | 160 |
| 1982 | 79 | 22 | 164 |
| 1983 | 82 | 22 | 164 |
| 1984 | 88 | 22 | 169 |
| 1985 | 88 | 22 | 171 |
| 1986 | 91 | 22 | 174 |
| 1987 | 91 | 22 | 175 |
| 1988 | 93 | 23 | 178 |
| 1989 | 94 | 23 | 186 |
| 1990 | 95 | 23 | 195 |
| 1991 | 95 | 23 | 202 |
| 1992 | 97 | 23 | 215 |
| 1993 | 98 | 26 | 235 |
| 1994 | 98 | 30 | 243 |
| 1995 | 98 | 31 | 256 |
| 1996 | 98 | 32 | 275 |
| 1997 | 98 | 37 | 285 |
| 1998 | 98 | 41 | 299 |
| 1999 | 98 | 45 | 319 |
| 2000 | 99 | 50 | 330 |
| 2001 | 99 | 56 | 339 |
| 2002 | 99 | 60 | 348 |
| 2003 | 100 | 64 | 370 |
| 2004 | 87 | 69 | 390 |
| 2005 | 87 | 74 | 408 |
| 2006 | 86 | 75 | 425 |
| 2007 | 86 | 76 | 436 |
| 2008 | 85 | 76 | 443 |
| 2009 | 85 | 81 | 447 |
| 2010 | 86 | 80 | 450 |
| 2011 | 86 | 75 | 456 |
| 2012 | 86 | 75 | 460 |
| 2013 | 86 | 74 | 464 |
| 2014 | 86 | 77 | 460 |
| 2015 | 86 | 78 | 464 |
| 2016 | 86 | 79 | 462 |
Source is Ministry of Education, Culture, Sports, Science and Technology. 学校基本調査 年次統計
www.e-stat.go.jp/SG1/estat/List.do?bid=000001015843
www.e-stat.go.jp/SG1/estat/Xlsdl.do?sinfid=000004469754
Related Topics