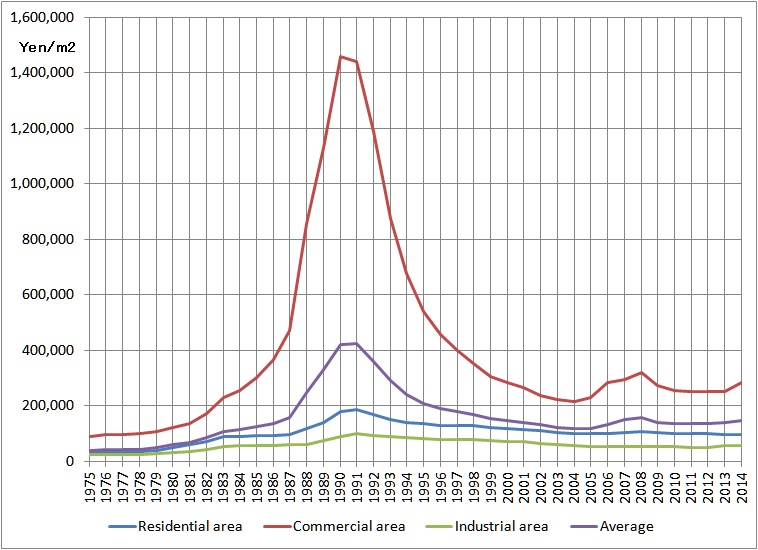
Aichi prefectural government reported the changes in the official land prices between 1975 and 2014. The following data show the changes in the average official land prices of Aichi (Nagoya city), 1975-2014. Unit is yen per square meter.

The land price recorded very high during the period of bubble economy (overheated economy) era (1990-1991).
The next figure shows the changes in the average official land prices for residential area.

If the price in 1975 is taken as 100, the trend of the land prices is like the below.

Table: Changes in the average of official land prices in Aichi, 1975-2014
Unit is yen per square meter.
| year | Residential area | Commercial area | Industrial area | Average | 1975=100 |
| 1975 | 30,700 | 91,500 | 23,500 | 41,000 | 100 |
| 1976 | 31,100 | 95,500 | 23,400 | 41,600 | 101 |
| 1977 | 32,300 | 96,500 | 24,500 | 42,500 | 105 |
| 1978 | 34,400 | 99,400 | 24,300 | 44,500 | 112 |
| 1979 | 39,900 | 106,000 | 26,900 | 49,600 | 130 |
| 1980 | 50,600 | 121,100 | 33,500 | 60,000 | 165 |
| 1981 | 59,700 | 136,000 | 36,300 | 69,400 | 194 |
| 1982 | 71,700 | 174,000 | 41,700 | 85,200 | 234 |
| 1983 | 88,400 | 231,000 | 54,600 | 109,000 | 288 |
| 1984 | 91,500 | 255,000 | 55,700 | 116,000 | 298 |
| 1985 | 93,100 | 301,100 | 57,900 | 125,000 | 303 |
| 1986 | 94,300 | 367,300 | 57,900 | 137,200 | 307 |
| 1987 | 97,700 | 473,000 | 59,400 | 159,000 | 318 |
| 1988 | 117,000 | 856,000 | 61,500 | 250,000 | 381 |
| 1989 | 141,000 | 1,130,000 | 74,600 | 330,000 | 459 |
| 1990 | 179,000 | 1,460,000 | 89,200 | 422,000 | 583 |
| 1991 | 188,000 | 1,440,000 | 100,000 | 425,100 | 612 |
| 1992 | 169,000 | 1,190,000 | 94,400 | 361,200 | 550 |
| 1993 | 151,000 | 877,000 | 89,000 | 290,400 | 492 |
| 1994 | 142,000 | 676,000 | 86,000 | 242,400 | 463 |
| 1995 | 136,000 | 540,000 | 83,200 | 209,800 | 443 |
| 1996 | 131,000 | 457,000 | 80,700 | 189,300 | 427 |
| 1997 | 129,600 | 399,300 | 78,900 | 178,100 | 422 |
| 1998 | 128,100 | 353,700 | 77,800 | 168,800 | 417 |
| 1999 | 122,000 | 305,500 | 73,900 | 155,300 | 397 |
| 2000 | 120,000 | 284,400 | 71,800 | 148,800 | 391 |
| 2001 | 116,700 | 265,200 | 70,200 | 141,900 | 380 |
| 2002 | 110,100 | 239,300 | 65,200 | 131,300 | 359 |
| 2003 | 103,700 | 223,500 | 60,300 | 123,400 | 338 |
| 2004 | 100,400 | 217,000 | 57,200 | 119,200 | 327 |
| 2005 | 99,000 | 230,500 | 55,200 | 120,300 | 322 |
| 2006 | 99,700 | 283,100 | 52,400 | 133,700 | 325 |
| 2007 | 105,600 | 296,300 | 54,100 | 149,800 | 344 |
| 2008 | 108,000 | 320,200 | 55,100 | 157,800 | 352 |
| 2009 | 102,600 | 273,200 | 53,300 | 141,800 | 334 |
| 2010 | 101,400 | 256,400 | 52,300 | 136,400 | 330 |
| 2011 | 101,200 | 253,200 | 51,400 | 135,500 | 330 |
| 2012 | 101,800 | 253,100 | 51,000 | 136,100 | 332 |
| 2013 | 95,800 | 253,300 | 57,200 | 140,000 | 312 |
| 2014 | 96,200 | 284,500 | 56,200 | 148,500 | 313 |
Source is Aichi prefectural government.
www.pref.aichi.jp/cmsfiles/contents/0000059/59681/02kakaku.pdf
Related Topics