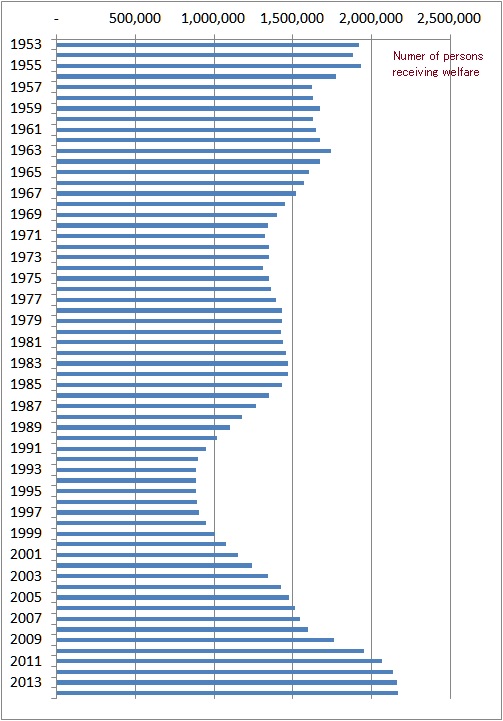
Changes in Number of People Receiving Welfare (Public Assistance) in Japan
In 2014 December, approximately 2.2 million people received the public assistance money from the Japanese government. The number of people receiving the public assistance money is increasing year by year. The following shows the changes in numbers of people receiving welfare (public assistance) in Japan, 1953-2014.

| Year | Number of persons |
| 1953 | 1,922,060 |
| 1954 | 1,881,687 |
| 1955 | 1,929,408 |
| 1956 | 1,775,971 |
| 1957 | 1,623,744 |
| 1958 | 1,627,571 |
| 1959 | 1,669,180 |
| 1960 | 1,627,509 |
| 1961 | 1,643,445 |
| 1962 | 1,674,001 |
| 1963 | 1,744,639 |
| 1964 | 1,674,661 |
| 1965 | 1,598,821 |
| 1966 | 1,570,054 |
| 1967 | 1,520,733 |
| 1968 | 1,449,970 |
| 1969 | 1,398,725 |
| 1970 | 1,344,306 |
| 1971 | 1,325,218 |
| 1972 | 1,349,000 |
| 1973 | 1,345,549 |
| 1974 | 1,312,339 |
| 1975 | 1,349,230 |
| 1976 | 1,358,316 |
| 1977 | 1,393,128 |
| 1978 | 1,428,261 |
| 1979 | 1,430,488 |
| 1980 | 1,426,984 |
| 1981 | 1,439,226 |
| 1982 | 1,457,383 |
| 1983 | 1,468,245 |
| 1984 | 1,469,457 |
| 1985 | 1,431,117 |
| 1986 | 1,348,163 |
| 1987 | 1,266,126 |
| 1988 | 1,176,258 |
| 1989 | 1,099,520 |
| 1990 | 1,014,842 |
| 1991 | 946,374 |
| 1992 | 898,499 |
| 1993 | 883,112 |
| 1994 | 884,912 |
| 1995 | 882,229 |
| 1996 | 887,450 |
| 1997 | 905,589 |
| 1998 | 946,994 |
| 1999 | 1,004,472 |
| 2000 | 1,072,241 |
| 2001 | 1,148,088 |
| 2002 | 1,242,723 |
| 2003 | 1,344,327 |
| 2004 | 1,423,388 |
| 2005 | 1,475,838 |
| 2006 | 1,513,892 |
| 2007 | 1,543,321 |
| 2008 | 1,592,620 |
| 2009 | 1,763,572 |
| 2010 | 1,952,063 |
| 2011 | 2,067,244 |
| 2012 | 2,135,708 |
| 2013 | 2,158,643 |
| 2014 | 2,165,091 |
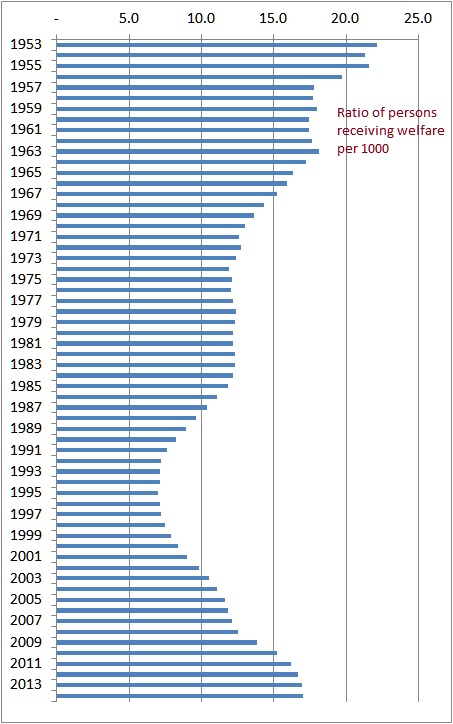
The next data shows the changes in the ratio of people receiving welfare per 1,000.

| Year | Ratio of persons receiving welfare per 1000 residents |
| 1953 | 22.1 |
| 1954 | 21.3 |
| 1955 | 21.6 |
| 1956 | 19.7 |
| 1957 | 17.8 |
| 1958 | 17.7 |
| 1959 | 18.0 |
| 1960 | 17.4 |
| 1961 | 17.4 |
| 1962 | 17.6 |
| 1963 | 18.1 |
| 1964 | 17.2 |
| 1965 | 16.3 |
| 1966 | 15.9 |
| 1967 | 15.2 |
| 1968 | 14.3 |
| 1969 | 13.6 |
| 1970 | 13.0 |
| 1971 | 12.6 |
| 1972 | 12.7 |
| 1973 | 12.4 |
| 1974 | 11.9 |
| 1975 | 12.1 |
| 1976 | 12.0 |
| 1977 | 12.2 |
| 1978 | 12.4 |
| 1979 | 12.3 |
| 1980 | 12.2 |
| 1981 | 12.2 |
| 1982 | 12.3 |
| 1983 | 12.3 |
| 1984 | 12.2 |
| 1985 | 11.8 |
| 1986 | 11.1 |
| 1987 | 10.4 |
| 1988 | 9.6 |
| 1989 | 8.9 |
| 1990 | 8.2 |
| 1991 | 7.6 |
| 1992 | 7.2 |
| 1993 | 7.1 |
| 1994 | 7.1 |
| 1995 | 7.0 |
| 1996 | 7.1 |
| 1997 | 7.2 |
| 1998 | 7.5 |
| 1999 | 7.9 |
| 2000 | 8.4 |
| 2001 | 9.0 |
| 2002 | 9.8 |
| 2003 | 10.5 |
| 2004 | 11.1 |
| 2005 | 11.6 |
| 2006 | 11.8 |
| 2007 | 12.1 |
| 2008 | 12.5 |
| 2009 | 13.8 |
| 2010 | 15.2 |
| 2011 | 16.2 |
| 2012 | 16.7 |
| 2013 | 17.0 |
| 2014 | 17.0 |
Source is National Institute of Population and Social Security Research.
www.ipss.go.jp/s-info/j/seiho/seiho.asp 「生活保護」に関する公的統計データ一覧
www.ipss.go.jp/s-info/j/seiho/seihoH26/H26-16.xlsx
Related Topics