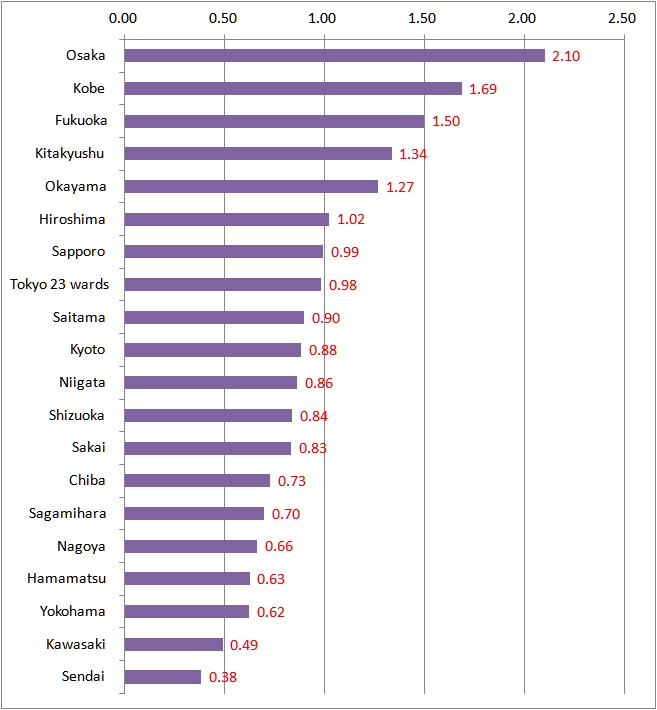
Murder Rate in Major Cities of Japan, 2012
The below is the latest data on the homicide rate in major cities in Japan in 2012. Comparing to 2011 data, the former most dangerous city Sakai went down its rank to 13th place. Former No.2 Osaka got their regular seat "the most dangerous city in Japan" back. Tokyo got the same rank No. 8.
Table : Murder Rate in Major Cities of Japan, 2012
| City | Prefecture | Population | Number of Murders | Rate (per 100,000) | 2011 rank | |
| 大阪 | Osaka | Osaka | 2,665,373 | 56 | 2.10 | 2 |
| 神戸 | Kobe | Hyogo | 1,542,458 | 26 | 1.69 | 4 |
| 福岡 | Fukuoka | Fukuoka | 1,469,069 | 22 | 1.50 | 15 |
| 北九州 | Kitakyushu | Fukuoka | 973,161 | 13 | 1.34 | 5 |
| 岡山 | Okayama | Okayama | 709,754 | 9 | 1.27 | 16 |
| 広島 | Hiroshima | Hiroshima | 1,173,173 | 12 | 1.02 | 3 |
| 札幌 | Sapporo | Hokkaido | 1,915,542 | 19 | 0.99 | 13 |
| 東京 | Tokyo 23 wards | Tokyo | 8,962,948 | 88 | 0.98 | 8 |
| 埼玉 | Saitama | Saitama | 1,226,324 | 11 | 0.90 | 9 |
| 京都 | Kyoto | Kyoto | 1,471,400 | 13 | 0.88 | 6 |
| 新潟 | Niigata | Niigata | 810,086 | 7 | 0.86 | 20 |
| 静岡 | Shizuoka | Shizuoka | 714,530 | 6 | 0.84 | 19 |
| 堺 | Sakai | Osaka | 842,013 | 7 | 0.83 | 1 |
| 千葉 | Chiba | Chiba | 963,088 | 7 | 0.73 | 14 |
| 相模原 | Sagamihara | Kanagawa | 717,701 | 5 | 0.70 | 18 |
| 名古屋 | Nagoya | Aichi | 2,260,892 | 15 | 0.66 | 7 |
| 浜松 | Hamamatsu | Shizuoka | 799,436 | 5 | 0.63 | 17 |
| 横浜 | Yokohama | Kanagawa | 3,687,311 | 23 | 0.62 | 11 |
| 川崎 | Kawasaki | Kanagawa | 1,426,943 | 7 | 0.49 | 12 |
| 仙台 | Sendai | Miyagi | 1,046,654 | 4 | 0.38 | 10 |
Figure : Murder Rate in Major Cities of Japan, 2012 (per 100,000)

Source is City of Yokohama.
www.city.yokohama.lg.jp/ex/stat/daitoshi/index4.html#17
www.city.yokohama.lg.jp/ex/stat/daitoshi/h24/data/h170100.xls
Related Topics