Ministry of Health, Labour and Welfare measures people's BMI (Body Mass Index) every year. According to it, the average BMI of Japanese people is 23.6 for men, 22.5 for women.
High BMI means more fat. The below shows the categories by BMI range.
| Category | BMI |
| Very severely underweight | less than 15 |
| Severely underweight | from 15.0 to 16.0 |
| Underweight | from 16.0 to 18.5 |
| Normal (healthy weight) | from 18.5 to 25 |
| Overweight | from 25 to 30 |
| Obese Class I (Moderately obese) | from 30 to 35 |
| Obese Class II (Severely obese) | from 35 to 40 |
| Obese Class III (Very severely obese) | over 40 |
Table 1: Men's ranking of BMI
| Rank | Prefecture | No. of samples | Average BMI |
| 1 | Nagasaki | 122 | 24.4 |
| 2 | Aomori | 165 | 24.3 |
| 3 | Iwate | 134 | 24.3 |
| 4 | Akita | 161 | 24.3 |
| 5 | Okinawa | 180 | 24.3 |
| 6 | Ibaraki | 203 | 24.2 |
| 7 | Kanagawa | 183 | 24.2 |
| 8 | Kagawa | 215 | 24.2 |
| 9 | Miyagi | 159 | 24.1 |
| 10 | Ehime | 147 | 24.1 |
| 11 | Kochi | 76 | 24.1 |
| 12 | Tokushima | 122 | 24.0 |
| 13 | Kumamoto | 103 | 24.0 |
| 14 | Oita | 195 | 24.0 |
| 15 | Yamagata | 143 | 23.9 |
| 16 | Shimane | 161 | 23.9 |
| 17 | Fukushima | 129 | 23.8 |
| 18 | Gunma | 253 | 23.8 |
| 19 | Hyogo | 130 | 23.8 |
| 20 | Okayama | 133 | 23.8 |
| 21 | Tochigi | 288 | 23.7 |
| 22 | Yamanashi | 200 | 23.7 |
| 23 | Hiroshima | 143 | 23.7 |
| 24 | Kagoshima | 59 | 23.7 |
| 25 | Hokkaido | 90 | 23.6 |
| 26 | Saitama | 217 | 23.6 |
| 27 | Miyazaki | 121 | 23.6 |
| 28 | Chiba | 200 | 23.5 |
| 29 | Aichi | 100 | 23.5 |
| 30 | Yamaguchi | 112 | 23.5 |
| 31 | Tokyo | 143 | 23.4 |
| 32 | Nagano | 259 | 23.4 |
| 33 | Shizuoka | 202 | 23.4 |
| 34 | Shiga | 104 | 23.4 |
| 35 | Kyoto | 82 | 23.4 |
| 36 | Nara | 187 | 23.4 |
| 37 | Wakayama | 103 | 23.3 |
| 38 | Saga | 152 | 23.3 |
| 39 | Fukui | 131 | 23.2 |
| 40 | Tottori | 173 | 23.2 |
| 41 | Niigata | 172 | 23.1 |
| 42 | Toyama | 127 | 23.1 |
| 43 | Ishikawa | 155 | 23.1 |
| 44 | Osaka | 99 | 23.1 |
| 45 | Gifu | 176 | 23.0 |
| 46 | Fukuoka | 188 | 23.0 |
| 47 | Mie | 85 | 22.8 |
| Average | 7,182 | 23.6 |
Table 2: Women's ranking of BMI
| Rank | Prefecture | No. of samples | Average BMI |
| 1 | Okinawa | 154 | 23.9 |
| 2 | Nagasaki | 111 | 23.6 |
| 3 | Iwate | 132 | 23.4 |
| 4 | Kochi | 79 | 23.4 |
| 5 | Akita | 173 | 23.3 |
| 6 | Aomori | 126 | 23.2 |
| 7 | Tochigi | 205 | 23.2 |
| 8 | Kyoto | 107 | 23.2 |
| 9 | Ehime | 142 | 23.1 |
| 10 | Oita | 145 | 23.1 |
| 11 | Miyagi | 118 | 23.0 |
| 12 | Fukushima | 117 | 23.0 |
| 13 | Gunma | 191 | 23.0 |
| 14 | Tokushima | 116 | 23.0 |
| 15 | Fukui | 131 | 22.9 |
| 16 | Kumamoto | 133 | 22.9 |
| 17 | Hokkaido | 80 | 22.8 |
| 18 | Yamagata | 177 | 22.8 |
| 19 | Ibaraki | 200 | 22.8 |
| 20 | Okayama | 127 | 22.8 |
| 21 | Toyama | 140 | 22.7 |
| 22 | Aichi | 85 | 22.7 |
| 23 | Osaka | 100 | 22.6 |
| 24 | Shimane | 150 | 22.6 |
| 25 | Miyazaki | 122 | 22.6 |
| 26 | Nagano | 201 | 22.5 |
| 27 | Shizuoka | 146 | 22.5 |
| 28 | Chiba | 166 | 22.4 |
| 29 | Niigata | 166 | 22.4 |
| 30 | Hyogo | 129 | 22.4 |
| 31 | Hiroshima | 111 | 22.4 |
| 32 | Yamaguchi | 113 | 22.4 |
| 33 | Yamanashi | 171 | 22.3 |
| 34 | Saga | 134 | 22.3 |
| 35 | Saitama | 168 | 22.2 |
| 36 | Nara | 167 | 22.2 |
| 37 | Kagawa | 184 | 22.2 |
| 38 | Fukuoka | 164 | 22.2 |
| 39 | Kagoshima | 96 | 22.2 |
| 40 | Shiga | 110 | 22.1 |
| 41 | Tottori | 152 | 22.1 |
| 42 | Tokyo | 104 | 22.0 |
| 43 | Ishikawa | 146 | 22.0 |
| 44 | Gifu | 145 | 22.0 |
| 45 | Wakayama | 101 | 22.0 |
| 46 | Kanagawa | 126 | 21.6 |
| 47 | Mie | 85 | 21.5 |
| Average | 6,446 | 22.5 |
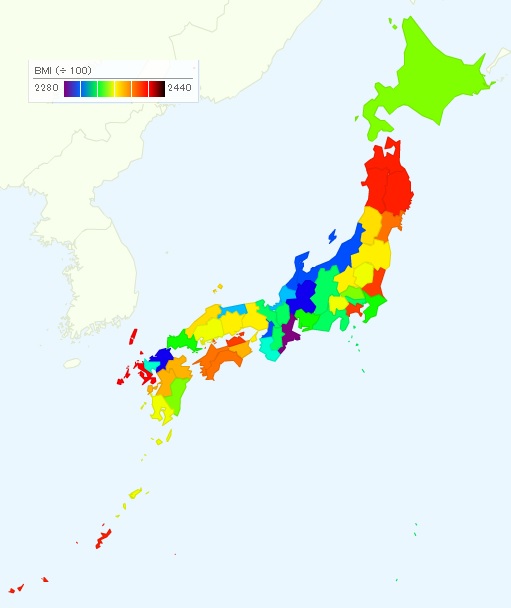
Figure 1: Men's BMI
Red means fat, purple means not fat.

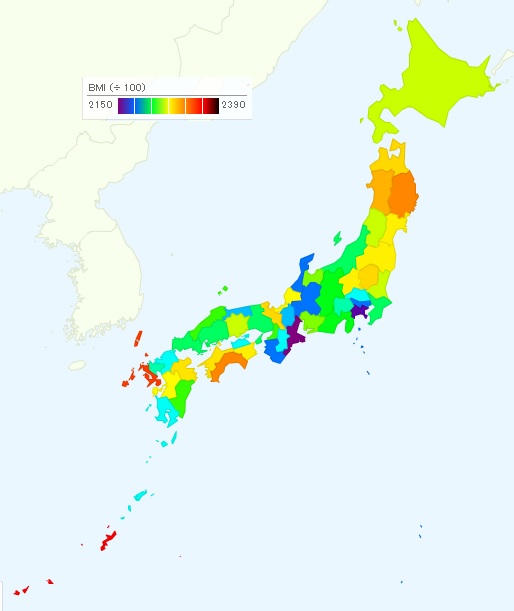
Figure 2: Women's BMI
Red means fat, purple means not fat.

People in Okinawa, Nagasaki, and Iwate have relatively high figures.
People in Mie, Wakayama, Tottori, Gifu, and Ishikawa are relatively not fat.
I do not think there are big differences between prefectures. The numbers are almost same around the country.
Source is Ministry of Health, Labour and Welfare. 平成24年国民健康・栄養調査報告
www.mhlw.go.jp/bunya/kenkou/eiyou/h24-houkoku.html
www.mhlw.go.jp/bunya/kenkou/eiyou/dl/h24-houkoku-07.pdf
Related Topics