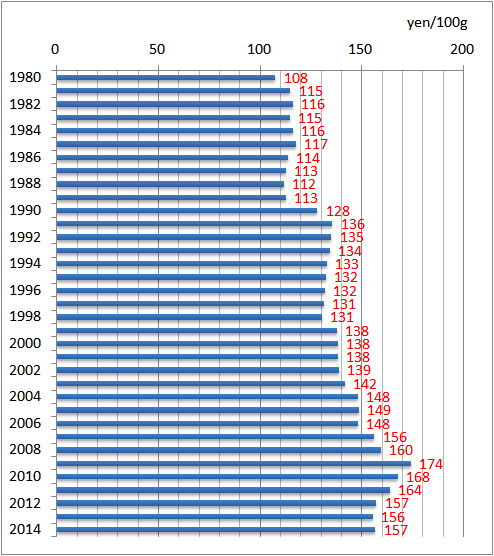
Ministry of Internal Affairs and Communications monitors many kinds of food prices monthly. Potato chips are one of the items which the ministry checks those prices.
The data below show the changes in the price indexes of potato chips between 1980 and 2014, if the price in 2010 is taken as 100.

| Year | Index (2010 = 100) | Price of 100g potato chips (yen) |
| 1980 | 64.0 | 108 |
| 1981 | 68.4 | 115 |
| 1982 | 69.1 | 116 |
| 1983 | 68.3 | 115 |
| 1984 | 69.1 | 116 |
| 1985 | 69.9 | 117 |
| 1986 | 67.7 | 114 |
| 1987 | 67.2 | 113 |
| 1988 | 66.5 | 112 |
| 1989 | 67.0 | 113 |
| 1990 | 76.3 | 128 |
| 1991 | 80.7 | 136 |
| 1992 | 80.4 | 135 |
| 1993 | 79.9 | 134 |
| 1994 | 79.1 | 133 |
| 1995 | 78.7 | 132 |
| 1996 | 78.5 | 132 |
| 1997 | 78.2 | 131 |
| 1998 | 77.7 | 131 |
| 1999 | 82.1 | 138 |
| 2000 | 82.2 | 138 |
| 2001 | 82.3 | 138 |
| 2002 | 82.5 | 139 |
| 2003 | 84.3 | 142 |
| 2004 | 88.2 | 148 |
| 2005 | 88.5 | 149 |
| 2006 | 88.1 | 148 |
| 2007 | 93.0 | 156 |
| 2008 | 95.0 | 160 |
| 2009 | 103.7 | 174 |
| 2010 | 100.0 | 168 |
| 2011 | 97.6 | 164 |
| 2012 | 93.6 | 157 |
| 2013 | 92.6 | 156 |
| 2014 | 93.3 | 157 |

Source is Statistics Bureau. 消費者物価指数 (CPI) 結果
www.stat.go.jp/data/cpi/historic.htm
www.e-stat.go.jp/SG1/estat/Csvdl.do?sinfid=000011288549
Related Topics