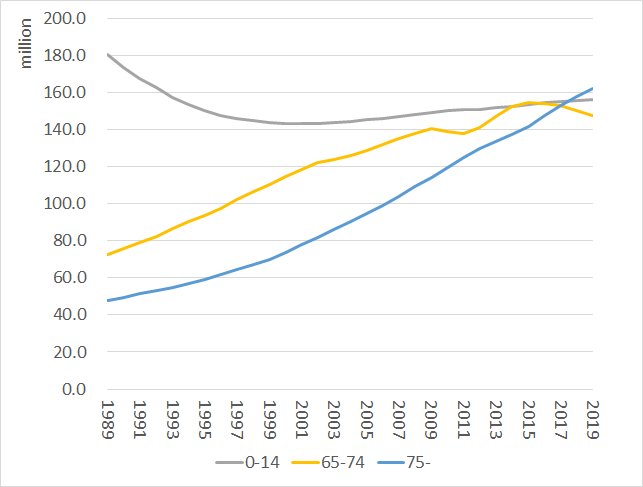
The following table shows the changes in the population of Tokyo Metropolitan residents between 1989 and 2019. In Tokyo the population of over 74 is bigger than those of children's.
Table: Changes in the Population of Tokyo Metropolitan, 1989-2019 (unit: million)
| Age | Age | Age | Age | ||
| Year | total | 0~14 | 15~64 | 65~74 | 75 & over |
| 1989 | 1171.1 | 180.2 | 870.6 | 72.8 | 47.5 |
| 1990 | 1169.6 | 173.3 | 871.2 | 75.6 | 49.6 |
| 1991 | 1169.5 | 167.5 | 871.6 | 78.9 | 51.5 |
| 1992 | 1168.5 | 162.3 | 870.5 | 82.4 | 53.4 |
| 1993 | 1164.6 | 157.3 | 866.1 | 86.3 | 55.0 |
| 1994 | 1161.0 | 153.2 | 860.8 | 90.1 | 56.8 |
| 1995 | 1159.4 | 150.1 | 856.5 | 93.8 | 59.1 |
| 1996 | 1160.5 | 147.6 | 853.5 | 97.6 | 61.7 |
| 1997 | 1164.1 | 145.9 | 851.7 | 102.1 | 64.4 |
| 1998 | 1169.1 | 144.6 | 850.7 | 106.6 | 67.2 |
| 1999 | 1174.5 | 143.5 | 850.5 | 110.4 | 70.1 |
| 2000 | 1181.3 | 142.9 | 850.1 | 114.5 | 73.8 |
| 2001 | 1189.5 | 142.9 | 850.6 | 118.2 | 77.7 |
| 2002 | 1198.7 | 143.3 | 851.8 | 121.9 | 81.8 |
| 2003 | 1206.4 | 143.6 | 852.7 | 124.0 | 86.0 |
| 2004 | 1214.7 | 144.4 | 854.3 | 125.8 | 90.3 |
| 2005 | 1223.4 | 145.2 | 855.3 | 128.4 | 94.5 |
| 2006 | 1232.8 | 146.0 | 855.7 | 132.0 | 99.1 |
| 2007 | 1242.3 | 147.1 | 856.2 | 135.0 | 104.0 |
| 2008 | 1251.1 | 148.1 | 855.9 | 137.9 | 109.1 |
| 2009 | 1259.0 | 149.0 | 855.8 | 140.2 | 114.0 |
| 2010 | 1264.5 | 150.0 | 856.2 | 138.9 | 119.4 |
| 2011 | 1268.7 | 150.5 | 855.9 | 137.6 | 124.7 |
| 2012 | 1273.5 | 150.9 | 852.0 | 141.0 | 129.6 |
| 2013 | 1280.3 | 151.6 | 848.4 | 146.7 | 133.6 |
| 2014 | 1287.4 | 152.5 | 845.5 | 152.2 | 137.2 |
| 2015 | 1295.6 | 153.5 | 845.7 | 154.6 | 141.8 |
| 2016 | 1304.1 | 154.4 | 848.2 | 154.2 | 147.3 |
| 2017 | 1311.3 | 155.0 | 851.1 | 152.6 | 152.6 |
| 2018 | 1318.4 | 155.5 | 855.2 | 150.0 | 157.7 |
| 2019 | 1325.7 | 156.1 | 860.2 | 147.6 | 161.9 |
Figure: Changes in the Population of Senior and Junior in Tokyo, 1989-2019 (unit: million)

Source is Statistics Division, Bureau of General Affairs, Tokyo Metropolitan.
www.toukei.metro.tokyo.jp/koureisya/kr-index.htm
www.toukei.metro.tokyo.jp/koureisya/kr19rc0000.xls
Related Topics