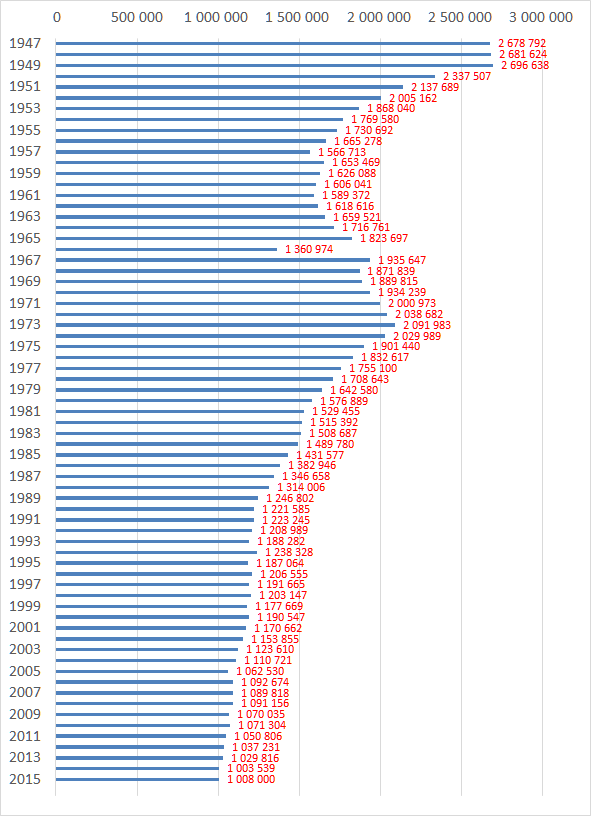
The following is the changes in the number of live births in Japan between 1947 and 2015.

| Year | Number of live births |
| 1947 | 2,678,792 |
| 1948 | 2,681,624 |
| 1949 | 2,696,638 |
| 1950 | 2,337,507 |
| 1951 | 2,137,689 |
| 1952 | 2,005,162 |
| 1953 | 1,868,040 |
| 1954 | 1,769,580 |
| 1955 | 1,730,692 |
| 1956 | 1,665,278 |
| 1957 | 1,566,713 |
| 1958 | 1,653,469 |
| 1959 | 1,626,088 |
| 1960 | 1,606,041 |
| 1961 | 1,589,372 |
| 1962 | 1,618,616 |
| 1963 | 1,659,521 |
| 1964 | 1,716,761 |
| 1965 | 1,823,697 |
| 1966 | 1,360,974 |
| 1967 | 1,935,647 |
| 1968 | 1,871,839 |
| 1969 | 1,889,815 |
| 1970 | 1,934,239 |
| 1971 | 2,000,973 |
| 1972 | 2,038,682 |
| 1973 | 2,091,983 |
| 1974 | 2,029,989 |
| 1975 | 1,901,440 |
| 1976 | 1,832,617 |
| 1977 | 1,755,100 |
| 1978 | 1,708,643 |
| 1979 | 1,642,580 |
| 1980 | 1,576,889 |
| 1981 | 1,529,455 |
| 1982 | 1,515,392 |
| 1983 | 1,508,687 |
| 1984 | 1,489,780 |
| 1985 | 1,431,577 |
| 1986 | 1,382,946 |
| 1987 | 1,346,658 |
| 1988 | 1,314,006 |
| 1989 | 1,246,802 |
| 1990 | 1,221,585 |
| 1991 | 1,223,245 |
| 1992 | 1,208,989 |
| 1993 | 1,188,282 |
| 1994 | 1,238,328 |
| 1995 | 1,187,064 |
| 1996 | 1,206,555 |
| 1997 | 1,191,665 |
| 1998 | 1,203,147 |
| 1999 | 1,177,669 |
| 2000 | 1,190,547 |
| 2001 | 1,170,662 |
| 2002 | 1,153,855 |
| 2003 | 1,123,610 |
| 2004 | 1,110,721 |
| 2005 | 1,062,530 |
| 2006 | 1,092,674 |
| 2007 | 1,089,818 |
| 2008 | 1,091,156 |
| 2009 | 1,070,035 |
| 2010 | 1,071,304 |
| 2011 | 1,050,806 |
| 2012 | 1,037,231 |
| 2013 | 1,029,816 |
| 2014 | 1,003,539 |
| 2015 | 1,008,000 |
Source is Ministry of Health, Labour and Welfare. 人口動態調査 平成27年(2015)人口動態統計の年間推計
www.mhlw.go.jp/toukei/saikin/hw/jinkou/suikei15/index.html
www.mhlw.go.jp/toukei/saikin/hw/jinkou/suikei15/xls/2015zuhyou.xls
Related Topics