Result of Nationwide Physical Performance Test by Prefecture in Japan, 2014
Yesterday I posted the data of the nationwide physical performance test. But I realized it was the last year's data. Today I post this year's data. This year, Fukui prefecture has the highest performance scores in all four categories (5th grade boys and girls, 8th grade boys and girls).
Figure 1: Result of 5th Grade (10-11 years old) Male Students, 2014
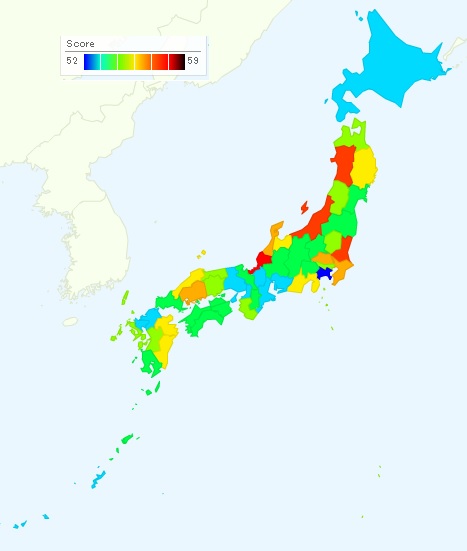
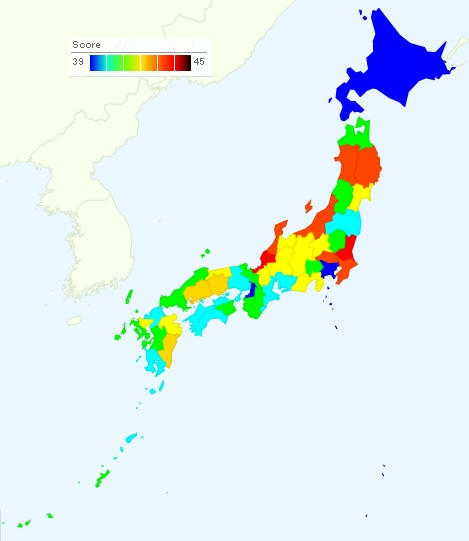
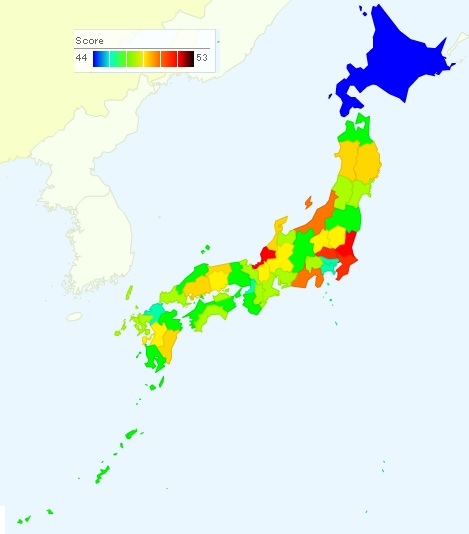
Red is good, blue is not so good.

Figure 2: Result of 5th Grade (10-11 years old) Female Students, 2014

Figure 3: Result of 8th Grade (13-14 years old) Male Students, 2014

Figure 4 : Result of 8th Grade (13-14 years old) Female Students, 2014

Table 1 : Result of 5th Grade (10-11 years old) Students, 2014
| Boy | Girl | |||
| Prefecture | Number of sample | Average Score | Number of sample | Average Score |
| Hokkaido | 20,520 | 52.54 | 20,083 | 53.04 |
| Aomori | 5,445 | 53.33 | 5,226 | 55.58 |
| Iwate | 5,531 | 54.41 | 5,137 | 56.48 |
| Miyagi | 9,837 | 53.04 | 9,570 | 54.57 |
| Akita | 3,817 | 56.27 | 3,616 | 58.24 |
| Yamagata | 4,529 | 53.61 | 4,432 | 55.76 |
| Fukushima | 8,282 | 52.62 | 8,040 | 54.85 |
| Ibaraki | 13,131 | 56.49 | 12,560 | 58.87 |
| Tochigi | 8,673 | 53.60 | 8,351 | 55.55 |
| Gunma | 8,850 | 53.31 | 8,447 | 54.60 |
| Saitama | 29,404 | 55.90 | 28,388 | 57.71 |
| Chiba | 24,284 | 55.46 | 23,619 | 57.07 |
| Tokyo | 44,300 | 54.16 | 41,842 | 55.21 |
| Kanagawa | 33,835 | 52.49 | 32,594 | 52.47 |
| Niigata | 9,520 | 56.58 | 9,044 | 58.34 |
| Toyama | 4,544 | 54.96 | 4,382 | 56.31 |
| Ishikawa | 5,054 | 56.32 | 4,875 | 57.25 |
| Fukui | 3,496 | 57.87 | 3,375 | 59.44 |
| Yamanashi | 3,553 | 52.88 | 3,277 | 54.07 |
| Nagano | 8,683 | 53.84 | 8,558 | 54.66 |
| Gifu | 9,288 | 53.84 | 8,877 | 54.93 |
| Shizuoka | 15,783 | 54.12 | 15,207 | 56.21 |
| Aichi | 33,614 | 52.22 | 32,325 | 53.46 |
| Mie | 7,700 | 53.09 | 7,462 | 53.96 |
| Shiga | 6,521 | 53.45 | 6,221 | 53.82 |
| Kyoto | 9,624 | 53.62 | 9,380 | 54.21 |
| Osaka | 33,800 | 52.52 | 32,852 | 53.16 |
| Hyogo | 22,931 | 53.16 | 22,214 | 53.60 |
| Nara | 5,775 | 53.93 | 5,207 | 54.61 |
| Wakayama | 3,997 | 54.57 | 3,890 | 55.81 |
| Tottori | 2,547 | 54.29 | 2,330 | 55.54 |
| Shimane | 2,741 | 55.27 | 2,677 | 56.23 |
| Okayama | 8,381 | 55.09 | 7,991 | 55.65 |
| Hiroshima | 11,930 | 55.90 | 11,572 | 57.14 |
| Yamaguchi | 5,671 | 53.55 | 5,482 | 54.43 |
| Tokushima | 2,980 | 53.24 | 2,871 | 54.88 |
| Kagawa | 4,345 | 53.35 | 4,134 | 54.55 |
| Ehime | 6,038 | 53.49 | 5,681 | 54.95 |
| Kochi | 2,785 | 53.37 | 2,726 | 54.67 |
| Fukuoka | 20,159 | 53.62 | 19,764 | 53.99 |
| Saga | 3,666 | 53.42 | 3,614 | 53.53 |
| Nagasaki | 5,842 | 54.13 | 5,735 | 55.52 |
| Kumamoto | 7,924 | 54.65 | 7,559 | 55.93 |
| Oita | 4,495 | 55.36 | 4,296 | 56.21 |
| Miyazaki | 5,006 | 55.12 | 4,779 | 56.26 |
| Kagoshima | 7,035 | 53.43 | 6,731 | 54.75 |
| Okinawa | 6,936 | 52.84 | 6,762 | 53.30 |
Table 2 : Result of 8th Grade (13-14 years old) Students, 2014
| Boy | Girl | |||
| Prefecture | Number of sample | Average Score | Number of sample | Average Score |
| Hokkaido | 18,011 | 39.69 | 17,168 | 44.16 |
| Aomori | 5,322 | 41.95 | 5,142 | 47.95 |
| Iwate | 5,552 | 44.07 | 5,099 | 50.36 |
| Miyagi | 8,731 | 42.05 | 8,432 | 48.1 |
| Akita | 3,975 | 44.15 | 3,807 | 50.04 |
| Yamagata | 4,612 | 41.68 | 4,458 | 48.79 |
| Fukushima | 8,244 | 40.56 | 7,495 | 47.74 |
| Ibaraki | 11,947 | 45.47 | 11,569 | 53.13 |
| Tochigi | 7,989 | 41.65 | 7,625 | 49.06 |
| Gunma | 8,533 | 42.14 | 8,214 | 49.58 |
| Saitama | 27,079 | 44.38 | 25,531 | 52.66 |
| Chiba | 21,164 | 44.29 | 20,122 | 52.07 |
| Tokyo | 32,997 | 39.71 | 30,556 | 46.73 |
| Kanagawa | 27,504 | 39.92 | 26,656 | 46.18 |
| Niigata | 8,859 | 44.84 | 8,363 | 51.38 |
| Toyama | 4,406 | 42.25 | 4,165 | 48.08 |
| Ishikawa | 4,902 | 44.12 | 4,774 | 50.52 |
| Fukui | 3,289 | 45.83 | 3,325 | 53.14 |
| Yamanashi | 3,290 | 41.47 | 3,028 | 48.09 |
| Nagano | 8,532 | 42.11 | 8,074 | 47.38 |
| Gifu | 8,419 | 42.82 | 8,153 | 49.32 |
| Shizuoka | 14,352 | 42.79 | 13,262 | 51.10 |
| Aichi | 31,122 | 40.75 | 29,804 | 48.60 |
| Mie | 7,670 | 40.95 | 7,115 | 48.00 |
| Shiga | 5,780 | 42.62 | 5,486 | 49.12 |
| Kyoto | 8,580 | 41.75 | 8,320 | 48.09 |
| Osaka | 29,543 | 39.92 | 28,647 | 46.88 |
| Hyogo | 19,709 | 40.41 | 19,161 | 47.92 |
| Nara | 4,787 | 41.83 | 4,594 | 48.29 |
| Wakayama | 3,843 | 41.27 | 3,566 | 47.6 |
| Tottori | 2,401 | 42.97 | 2,264 | 50.05 |
| Shimane | 2,834 | 41.47 | 2,622 | 47.63 |
| Okayama | 7,883 | 43.07 | 7,487 | 49.87 |
| Hiroshima | 10,057 | 43.49 | 9,718 | 50.45 |
| Yamaguchi | 5,247 | 41.07 | 5,153 | 48.81 |
| Tokushima | 2,601 | 41.47 | 2,732 | 47.36 |
| Kagawa | 4,023 | 40.95 | 3,873 | 48.30 |
| Ehime | 5,687 | 40.82 | 5,350 | 47.94 |
| Kochi | 2,240 | 40.23 | 2,100 | 48.05 |
| Fukuoka | 18,554 | 40.66 | 17,463 | 46.85 |
| Saga | 3,637 | 42.51 | 3,370 | 48.46 |
| Nagasaki | 5,631 | 41.32 | 5,498 | 48.76 |
| Kumamoto | 7,650 | 41.59 | 7,152 | 49.00 |
| Oita | 3,956 | 42.17 | 3,731 | 47.89 |
| Miyazaki | 4,172 | 43.73 | 4,131 | 50.00 |
| Kagoshima | 6,739 | 40.71 | 6,541 | 47.97 |
| Okinawa | 6,526 | 41.46 | 6,296 | 47.53 |
Source is Ministry of Education, Culture, Sports, Science and Technology.
www.mext.go.jp/a_menu/sports/kodomo/zencyo/1353812.htm
平成26年度全国体力・運動能力、運動習慣等調査結果
www.mext.go.jp/component/a_menu/sports/detail/__icsFiles/afieldfile/2014/12/04/1353838_1.pdf
www.mext.go.jp/component/a_menu/sports/detail/__icsFiles/afieldfile/2014/12/04/1353838_4.pdf
Related Topics