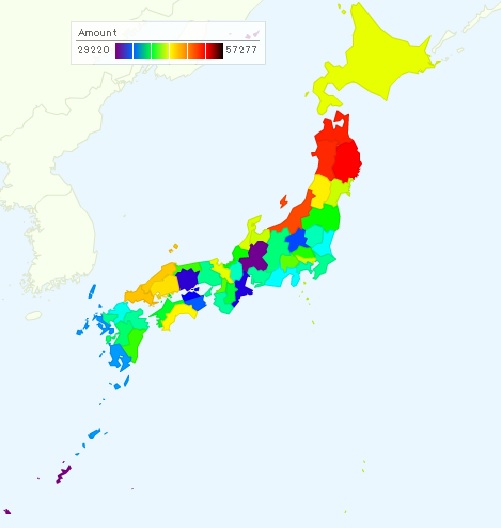
Consumption of Alcohol Beverage by City in Japan, Who is the hardest drinker?
Below shows consumption per capita of alcohol beverage in a year by city in Japan. It is the average figure from 2010 to 2012. Top 3 (Morioka, Aomori, Akita) are located in the northern side of Japan.
| City | Purchased Amount (Yen) | |
| Average | 41,506 | |
| 1 | Morioka | 57,277 |
| 2 | Aomori | 55,402 |
| 3 | Akita | 54,903 |
| 4 | Niigata | 53,177 |
| 5 | Yamaguchi | 49,786 |
| 6 | Matsue | 49,621 |
| 7 | Hiroshima | 48,277 |
| 8 | Yamagata | 46,826 |
| 9 | Kochi | 46,101 |
| 10 | Sapporo | 44,880 |
| 11 | Kyoto | 44,856 |
| 12 | Kanazawa | 44,668 |
| 13 | Tokyo | 44,468 |
| 14 | Sendai | 44,418 |
| 15 | Toyama | 44,389 |
| 16 | Kofu | 42,765 |
| 17 | Osaka | 42,585 |
| 18 | Tottori | 42,144 |
| 19 | Miyazaki | 42,051 |
| 20 | Saitama | 41,688 |
| 21 | Fukui | 41,377 |
| 22 | Fukushima | 41,354 |
| 23 | Sakai | 40,590 |
| 24 | Matsuyama | 40,578 |
| 25 | Kitakyushu | 40,460 |
| 26 | Nara | 40,351 |
| 27 | Kumamoto | 39,573 |
| 28 | Nagano | 39,333 |
| 29 | Kobe | 39,073 |
| 30 | Chiba | 38,976 |
| 31 | Saga | 38,926 |
| 32 | Nagoya | 38,872 |
| 33 | Oita | 38,830 |
| 34 | Wakayama | 38,808 |
| 35 | Yokohama | 38,600 |
| 36 | Kawasaki | 38,466 |
| 37 | Utsunomiya | 38,365 |
| 38 | Otsu | 38,225 |
| 39 | Fukuoka | 37,558 |
| 40 | Mito | 37,328 |
| 41 | Shizuoka | 37,276 |
| 42 | Kagoshima | 35,667 |
| 43 | Nagasaki | 35,607 |
| 44 | Hamamatsu | 35,017 |
| 45 | Tokushima | 34,701 |
| 46 | Maebashi | 34,356 |
| 47 | Takamatsu | 33,084 |
| 48 | Tsu | 32,219 |
| 49 | Okayama | 31,808 |
| 50 | Gifu | 29,747 |
| 51 | Naha | 29,220 |


Source is Statistics Bureau, Ministry of Internal Affairs and Communications.
www.stat.go.jp/data/kakei/zuhyou/rank12.xls
Related Topics