Consumption of Tea in Japan
The table below shows consumption of tea in Japan. Total consumption of tea is decreasing these days.
Table1: Consumption of tea (unit: ton)
| Green tea | Black tea | Oolong tea | Total | |
| 1980 | 104,027 | 7,599 | 4,232 | 115,858 |
| 1985 | 95,953 | 8,086 | 12,568 | 116,607 |
| 1989 | 92,719 | 13,516 | 14,478 | 120,713 |
| 1990 | 91,558 | 14,102 | 17,154 | 122,814 |
| 1991 | 90,460 | 13,345 | 20,365 | 124,170 |
| 1992 | 96,362 | 14,094 | 22,803 | 133,259 |
| 1993 | 97,276 | 12,699 | 19,123 | 129,098 |
| 1994 | 90,837 | 14,187 | 22,050 | 127,074 |
| 1995 | 90,806 | 17,834 | 20,996 | 129,636 |
| 1996 | 99,096 | 16,585 | 21,011 | 136,692 |
| 1997 | 102,008 | 19,783 | 21,186 | 142,977 |
| 1998 | 88,347 | 18,340 | 20,579 | 127,266 |
| 1999 | 99,792 | 13,807 | 23,415 | 137,014 |
| 2000 | 102,944 | 17,950 | 25,495 | 146,389 |
| 2001 | 106,940 | 16,500 | 27,136 | 150,576 |
| 2002 | 95,228 | 15,029 | 24,668 | 134,925 |
| 2003 | 101,382 | 15,500 | 21,389 | 138,271 |
| 2004 | 116,823 | 16,299 | 22,903 | 156,025 |
| 2005 | 114,091 | 15,445 | 20,730 | 150,266 |
| 2006 | 101,478 | 17,128 | 19,714 | 138,320 |
| 2007 | 102,066 | 16,603 | 21,110 | 139,779 |
| 2008 | 101,125 | 17,860 | 17,922 | 136,907 |
| 2009 | 89,905 | 17,399 | 16,544 | 123,848 |
| 2010 | 88,674 | 19,757 | 17,612 | 126,043 |
| 2011 | 87,106 | 19,802 | 16,776 | 123,684 |
| 2012 | 91,122 | 16,638 | 15,624 | 123,384 |

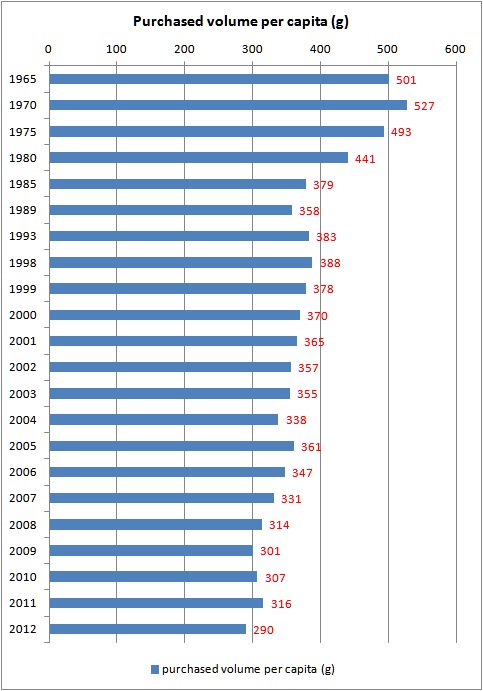
Table2: Purchased volume of tea in a year
| purchased volume per capita (g) | purchased amount per capita (yen) | purchased amount per capita (Euro) | purchased amount per capita ($) | Average price per 100g (yen) | |
| 1965 | 501 | 372 | 2.66 | 3.72 | 74 |
| 1970 | 527 | 745 | 5.32 | 7.45 | 141 |
| 1975 | 493 | 1,336 | 9.54 | 13.36 | 271 |
| 1980 | 441 | 1,769 | 12.64 | 17.69 | 401 |
| 1985 | 379 | 1,765 | 12.61 | 17.65 | 466 |
| 1989 | 358 | 1,786 | 12.76 | 17.86 | 499 |
| 1993 | 383 | 2,043 | 14.59 | 20.43 | 534 |
| 1998 | 388 | 2,122 | 15.16 | 21.22 | 547 |
| 1999 | 378 | 2,095 | 14.96 | 20.95 | 555 |
| 2000 | 370 | 2,102 | 15.01 | 21.02 | 567 |
| 2001 | 365 | 1,998 | 14.27 | 19.98 | 548 |
| 2002 | 357 | 1,911 | 13.65 | 19.11 | 535 |
| 2003 | 355 | 1,922 | 13.73 | 19.22 | 542 |
| 2004 | 338 | 1,748 | 12.49 | 17.48 | 518 |
| 2005 | 361 | 1,771 | 12.65 | 17.71 | 491 |
| 2006 | 347 | 1,735 | 12.39 | 17.35 | 501 |
| 2007 | 331 | 1,685 | 12.04 | 16.85 | 509 |
| 2008 | 314 | 1,607 | 11.48 | 16.07 | 513 |
| 2009 | 301 | 1,537 | 10.98 | 15.37 | 510 |
| 2010 | 307 | 1,432 | 10.23 | 14.32 | 467 |
| 2011 | 316 | 1,483 | 10.59 | 14.83 | 470 |
| 2012 | 290 | 1,395 | 9.96 | 13.95 | 480 |

Source of table 1,2 is Japanese Association of Tea Production.
www.zennoh.or.jp/bu/nousan/tea/seisan01b.htm
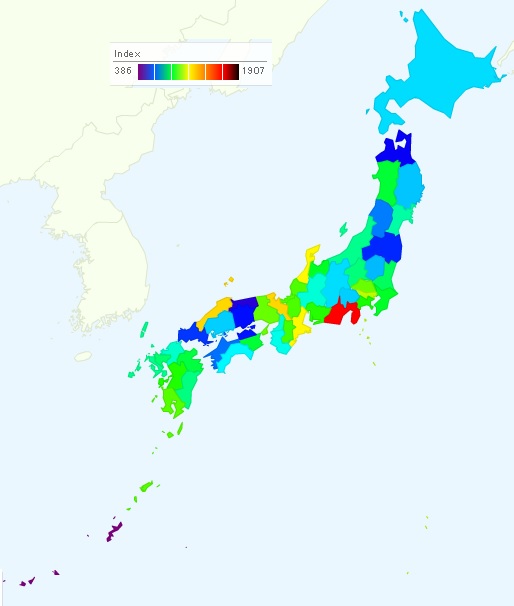
The following table shows consumption of green tea by notable city. It is the average figure from 2010 to 2012. People in Shizuoka and Hamamatsu (both are in Shizuoka prefecture) drink tea much. Shizuoka is a major producer of tea.
Table3: Consumption of green tea by notable city (unit: g)
| Average | 937 | |
| 1 | Shizuoka | 1,907 |
| 2 | Hamamatsu | 1,726 |
| 3 | Kyoto | 1,468 |
| 4 | Matsue | 1,465 |
| 5 | Tsu | 1,293 |
| 6 | Kanazawa | 1,282 |
| 7 | Tokyo | 1,197 |
| 8 | Saitama | 1,129 |
| 9 | Kobe | 1,127 |
| 10 | Kagoshima | 1,111 |
| 11 | Fukui | 1,104 |
| 12 | Otsu | 1,103 |
| 13 | Nara | 1,095 |
| 14 | Nagoya | 1,070 |
| 15 | Kumamoto | 1,064 |
| 16 | Yokohama | 1,056 |
| 17 | Toyama | 1,008 |
| 18 | Chiba | 1,005 |
| 19 | Akita | 992 |
| 20 | Tokushima | 992 |
| 21 | Oita | 985 |
| 22 | Mito | 959 |
| 23 | Saga | 946 |
| 24 | Maebashi | 933 |
| 25 | Miyazaki | 928 |
| 26 | Niigata | 918 |
| 27 | Nagasaki | 918 |
| 28 | Sakai City | 916 |
| 29 | Sendai | 898 |
| 30 | Kitakyushu | 888 |
| 31 | Fukuoka | 865 |
| 32 | Gifu | 854 |
| 33 | Osaka | 854 |
| 34 | Wakayama | 837 |
| 35 | Kochi | 815 |
| 36 | Kawasaki | 810 |
| 37 | Nagano | 793 |
| 38 | Sapporo | 792 |
| 39 | Kofu | 780 |
| 40 | Hiroshima | 780 |
| 41 | Morioka | 772 |
| 42 | Utsunomiya | 762 |
| 43 | Yamagata | 709 |
| 44 | Matsuyama | 700 |
| 45 | Yamaguchi | 650 |
| 46 | Fukushima | 636 |
| 47 | Takamatsu | 622 |
| 48 | Okayama | 614 |
| 49 | Aomori | 590 |
| 50 | Tottori | 535 |
| 51 | Naha | 386 |


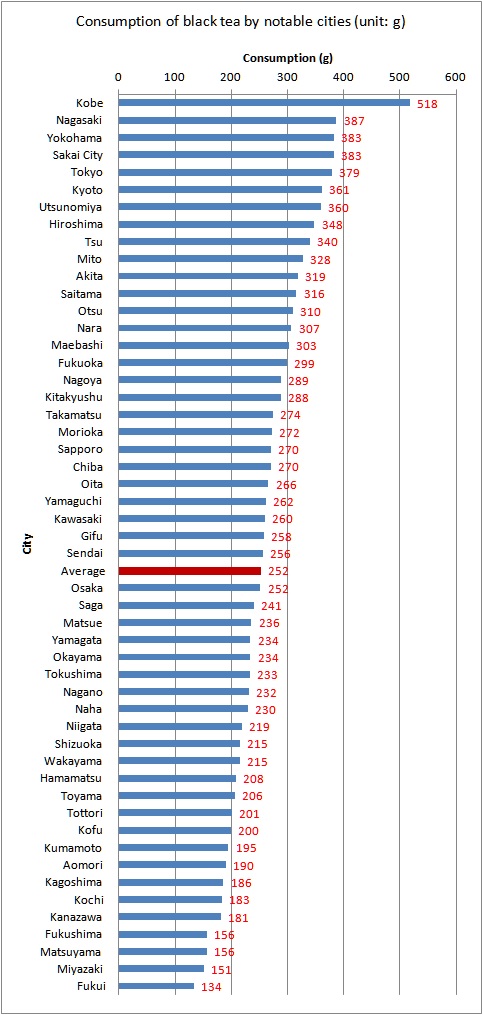
Next table shows consumption of black tea (like Assam, Darjeeling). It is the average figure from 2010 to 2012. Top 3 cities (Kobe, Nagasaki, Yokohama) are known as traditional port towns.
Table4 : Consumption of black tea by notable city (unit: g)
| Average | 252 | |
| 1 | Kobe | 518 |
| 2 | Nagasaki | 387 |
| 3 | Yokohama | 383 |
| 4 | Sakai City | 383 |
| 5 | Tokyo | 379 |
| 6 | Kyoto | 361 |
| 7 | Utsunomiya | 360 |
| 8 | Hiroshima | 348 |
| 9 | Tsu | 340 |
| 10 | Mito | 328 |
| 11 | Akita | 319 |
| 12 | Saitama | 316 |
| 13 | Otsu | 310 |
| 14 | Nara | 307 |
| 15 | Maebashi | 303 |
| 16 | Fukuoka | 299 |
| 17 | Nagoya | 289 |
| 18 | Kitakyushu | 288 |
| 19 | Takamatsu | 274 |
| 20 | Morioka | 272 |
| 21 | Sapporo | 270 |
| 22 | Chiba | 270 |
| 23 | Oita | 266 |
| 24 | Yamaguchi | 262 |
| 25 | Kawasaki | 260 |
| 26 | Gifu | 258 |
| 27 | Sendai | 256 |
| 28 | Osaka | 252 |
| 29 | Saga | 241 |
| 30 | Matsue | 236 |
| 31 | Yamagata | 234 |
| 32 | Okayama | 234 |
| 33 | Tokushima | 233 |
| 34 | Nagano | 232 |
| 35 | Naha | 230 |
| 36 | Niigata | 219 |
| 37 | Shizuoka | 215 |
| 38 | Wakayama | 215 |
| 39 | Hamamatsu | 208 |
| 40 | Toyama | 206 |
| 41 | Tottori | 201 |
| 42 | Kofu | 200 |
| 43 | Kumamoto | 195 |
| 44 | Aomori | 190 |
| 45 | Kagoshima | 186 |
| 46 | Kochi | 183 |
| 47 | Kanazawa | 181 |
| 48 | Fukushima | 156 |
| 49 | Matsuyama | 156 |
| 50 | Miyazaki | 151 |
| 51 | Fukui | 134 |


Source of table3,4 is Statistics Bureau, Ministry of Internal Affairs and Communications.
www.stat.go.jp/data/kakei/zuhyou/rank11.xls
Related Topics