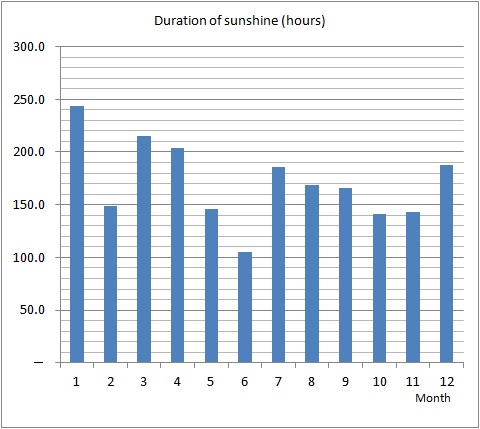
The following shows statistics of sunshine in Tokyo. It includes the yearly average amount of clouds, duration of sunshine and percentage of sunshine. There is also monthly data in terms of 2011.
| Average amount of clouds | Duration of sunshine (hours) | Percentage of sunshine | |
| 0(clear)-10(cloudy) | Hour | % | |
| 1989 | 6.7 | 1,832.7 | 41 |
| 1990 | 6.2 | 1,940.7 | 44 |
| 1991 | 6.6 | 1,733.0 | 39 |
| 1992 | 6.5 | 1,823.4 | 41 |
| 1993 | 6.7 | 1,711.9 | 39 |
| 1994 | 6.4 | 2,063.6 | 47 |
| 1995 | 6.2 | 2,028.1 | 46 |
| 1996 | 6.5 | 1,984.2 | 45 |
| 1997 | 6.3 | 2,063.9 | 47 |
| 1998 | 7.2 | 1,535.4 | 35 |
| 1999 | 6.3 | 2,008.1 | 45 |
| 2000 | 6.4 | 1,962.5 | 44 |
| 2001 | 6.2 | 1,976.5 | 45 |
| 2002 | 6.5 | 1,990.0 | 45 |
| 2003 | 7.0 | 1,723.2 | 39 |
| 2004 | 6.3 | 2,132.7 | 48 |
| 2005 | 6.4 | 1,965.0 | 44 |
| 2006 | 7.1 | 1,587.8 | 36 |
| 2007 | 6.5 | 1,996.0 | 45 |
| 2008 | 6.9 | 1,857.8 | 42 |
| 2009 | 7.0 | 1,783.3 | 40 |
| 2010 | 6.8 | 1,987.0 | 45 |
| 2011 | 6.4 | 2,056.2 | 46 |
| Jan. | 3.2 | 243.9 | 79 |
| Feb. | 5.7 | 148.9 | 49 |
| Mar. | 5.3 | 214.8 | 58 |
| Apr. | 5.7 | 204.0 | 52 |
| May | 8.0 | 146.3 | 34 |
| June | 9.0 | 105.1 | 24 |
| July | 7.0 | 186.2 | 42 |
| Aug. | 7.6 | 168.9 | 40 |
| Sept. | 7.1 | 165.8 | 45 |
| Oct. | 7.4 | 141.3 | 40 |
| Nov. | 6.7 | 143.4 | 47 |
| Dec. | 4.5 | 187.6 | 62 |

The graph shows monthly data. June is the rainy season. We can not expect sunshine in June.
Source : Tokyo District Meteorological Observatory
Related Topics: