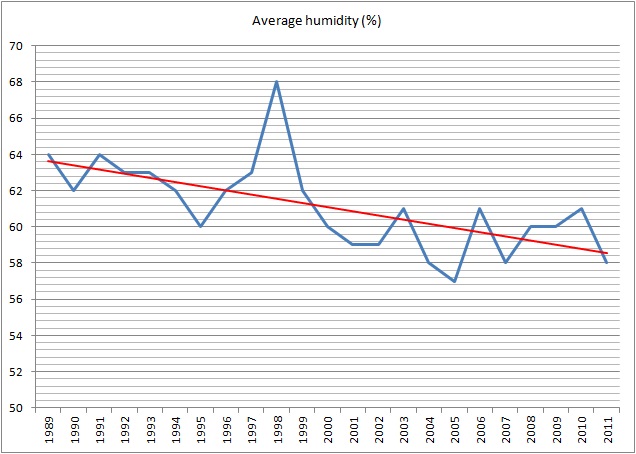
Average Humidity in Tokyo 1989-2011
The following table shows the yearly average humidity in Tokyo (1989-2011).
For 2011 you can see monthly data of the average humidity.
| Year | Average humidity (%) | Minimum humidity (%) | Date of minimum humidity (mm/dd) |
| 1989 | 64 | 16 | 4/13 |
| 1990 | 62 | 15 | 4/30 |
| 1991 | 64 | 15 | 3/7,4/22 |
| 1992 | 63 | 13 | 4/29 |
| 1993 | 63 | 15 | 5/11 |
| 1994 | 62 | 13 | 4/3 |
| 1995 | 60 | 16 | 11/18 |
| 1996 | 62 | 11 | 3/16 |
| 1997 | 63 | 11 | 4/25,26 |
| 1998 | 68 | 11 | 1/24 |
| 1999 | 62 | 11 | 12/21 |
| 2000 | 60 | 10 | 1/21 |
| 2001 | 59 | 10 | 12/14 |
| 2002 | 59 | 9 | 3/18 |
| 2003 | 61 | 6 | 2/28 |
| 2004 | 58 | 9 | 4/29 |
| 2005 | 57 | 9 | 3/21 |
| 2006 | 61 | 10 | 3/24 |
| 2007 | 58 | 10 | 4/14 |
| 2008 | 60 | 9 | 4/22,23 |
| 2009 | 60 | 11 | 4/9 |
| 2010 | 61 | 11 | 11/9 |
| 2011 | 58 | 9 | 1/16,4/4 |
| Jan. | 36 | 9 | 1/16 |
| Feb. | 52 | 15 | 2/1 |
| Mar. | 47 | 12 | 3/17 |
| Apr. | 50 | 9 | 4/4 |
| May | 63 | 12 | 5/15 |
| June | 71 | 33 | 6/6 |
| July | 67 | 37 | 7/1 |
| Aug. | 71 | 38 | 8/30 |
| Sept. | 68 | 34 | 9/24 |
| Oct. | 61 | 22 | 10/3 |
| Nov. | 58 | 17 | 11/17 |
| Dec. | 48 | 15 | 12/30 |
Yearly average humidity (%) in Tokyo Red line is the approximated curve. It seems Tokyo is getting drier slightly. Really?

The above is monthly chart of the average humidity in Tokyo (2011, unit %). In Tokyo, winter is dry and summer is wet.
Source : Tokyo District Meteorological Observatory
Related Topics