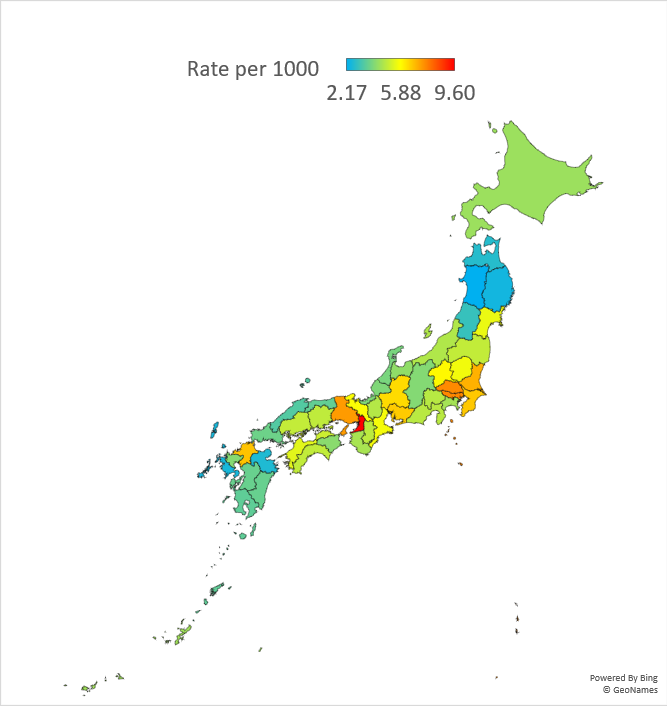
National Police Agency reports the data of crimes every year. According to it, the crime rate in 2019 is 5.9 per 1000 people. The following data show the detail by prefecture. In this post, the crime rate means the number of reported crimes per 1000 residents.
| Prefecture | Reported Crimes | Arrested Cases | Arrested Criminals | Population | Crime Rate per 1000 |
| Osaka | 84,672 | 12,461 | 6,848 | 8,823,000 | 9.60 |
| Tokyo | 104,664 | 18,071 | 10,758 | 13,724,000 | 7.63 |
| Saitama | 55,497 | 11,530 | 5,248 | 7,310,000 | 7.59 |
| Hyogo | 40,395 | 9,355 | 4,993 | 5,503,000 | 7.34 |
| Ibaraki | 20,312 | 5,292 | 1,756 | 2,892,000 | 7.02 |
| Fukuoka | 34,520 | 8,476 | 4,324 | 5,107,000 | 6.76 |
| Chiba | 41,793 | 8,455 | 4,052 | 6,246,000 | 6.69 |
| Aichi | 49,956 | 10,276 | 6,658 | 7,525,000 | 6.64 |
| Gifu | 12,857 | 2,973 | 1,471 | 2,008,000 | 6.40 |
| Gumma | 11,699 | 3,650 | 1,461 | 1,960,000 | 5.97 |
| Kyoto | 15,136 | 3,136 | 1,927 | 2,599,000 | 5.82 |
| Mie | 10,322 | 2,609 | 1,115 | 1,800,000 | 5.73 |
| Tochigi | 11,155 | 3,437 | 1,296 | 1,957,000 | 5.70 |
| Miyagi | 12,979 | 3,433 | 1,701 | 2,323,000 | 5.59 |
| Ehime | 7,446 | 2,086 | 1,116 | 1,364,000 | 5.46 |
| Kagawa | 4,962 | 1,720 | 734 | 967,000 | 5.13 |
| Hiroshima | 14,160 | 3,728 | 2,293 | 2,829,000 | 5.01 |
| Fukushima | 9,416 | 3,030 | 1,222 | 1,882,000 | 5.00 |
| Kochi | 3,562 | 1,080 | 527 | 714,000 | 4.99 |
| Okayama | 9,436 | 2,328 | 1,337 | 1,907,000 | 4.95 |
| Nara | 6,616 | 2,805 | 1,298 | 1,348,000 | 4.91 |
| Shizuoka | 17,876 | 4,810 | 2,727 | 3,675,000 | 4.86 |
| Yamanashi | 3,985 | 1,329 | 686 | 823,000 | 4.84 |
| Shiga | 6,771 | 1,969 | 988 | 1,413,000 | 4.79 |
| Niigata | 10,743 | 3,724 | 1,612 | 2,267,000 | 4.74 |
| Wakayama | 4,363 | 1,791 | 772 | 945,000 | 4.62 |
| Kanagawa | 41,780 | 11,561 | 5,803 | 9,159,000 | 4.56 |
| Okinawa | 6,514 | 2,292 | 1,575 | 1,443,000 | 4.51 |
| Hokkaido | 23,607 | 6,404 | 3,715 | 5,320,000 | 4.44 |
| Toyama | 4,508 | 1,347 | 814 | 1,056,000 | 4.27 |
| Tokushima | 3,111 | 1,207 | 511 | 743,000 | 4.19 |
| Saga | 3,400 | 1,589 | 626 | 824,000 | 4.13 |
| Nagano | 8,504 | 3,026 | 1,316 | 2,076,000 | 4.10 |
| Fukui | 3,132 | 1,311 | 565 | 779,000 | 4.02 |
| Ishikawa | 4,508 | 1,573 | 817 | 1,147,000 | 3.93 |
| Yamaguchi | 5,196 | 1,856 | 1,092 | 1,383,000 | 3.76 |
| Kumamoto | 6,498 | 2,154 | 1,294 | 1,765,000 | 3.68 |
| Miyazaki | 3,993 | 1,188 | 656 | 1,089,000 | 3.67 |
| Tottori | 2,029 | 1,085 | 527 | 565,000 | 3.59 |
| Kagoshima | 5,776 | 2,174 | 1,015 | 1,626,000 | 3.55 |
| Shimane | 2,310 | 1,087 | 500 | 685,000 | 3.37 |
| Yamagata | 3,275 | 1,383 | 656 | 1,102,000 | 2.97 |
| Aomori | 3,488 | 1,250 | 810 | 1,278,000 | 2.73 |
| Oita | 3,018 | 938 | 563 | 1,152,000 | 2.62 |
| Nagasaki | 3,394 | 1,428 | 988 | 1,354,000 | 2.51 |
| Iwate | 3,063 | 1,293 | 716 | 1,255,000 | 2.44 |
| Akita | 2,162 | 1,197 | 665 | 996,000 | 2.17 |

The source is National Police Agency.
www.npa.go.jp/publications/statistics/sousa/statistics.html
www.e-stat.go.jp/stat-search/file-download?statInfId=000031911224&fileKind=0
Related Topics