Japanese government checks the price of a pack of instant ramen every month, and has been calculated its price indexes since 1970.
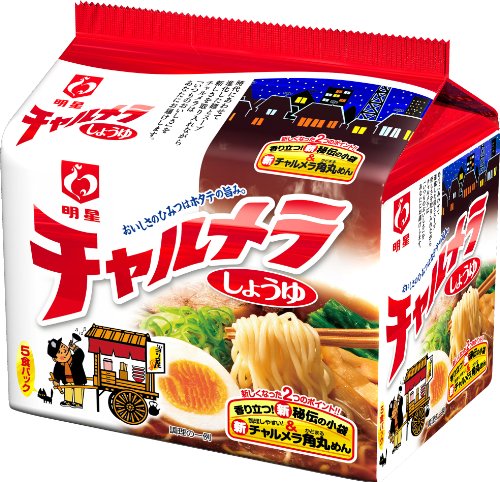
 (5 packs set of instant ramen)
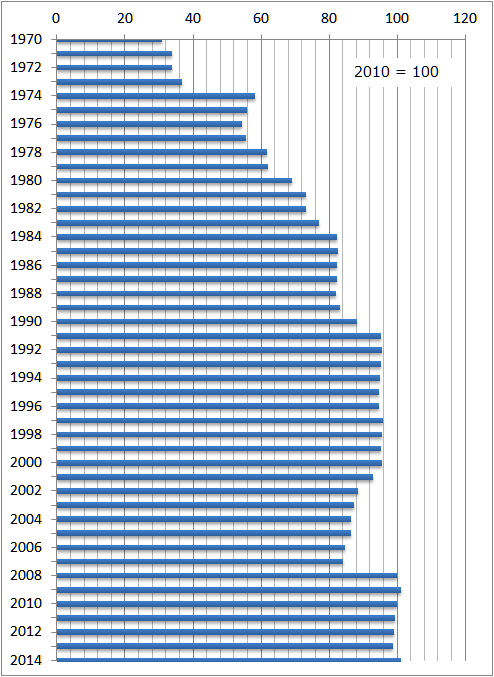
The data below show the changes in the price indexes of instant ramen (77g pack) between 1970 and 2014, if the price in 2010 is taken as 100.
Currently the instant ramen price has recorded the highest ever.

| Year | Index (2010 = 100) | Price of 77g instant ramen (yen) |
| 1970 | 31.0 | 45 |
| 1971 | 33.7 | 49 |
| 1972 | 33.8 | 49 |
| 1973 | 36.8 | 53 |
| 1974 | 58.3 | 84 |
| 1975 | 55.9 | 80 |
| 1976 | 54.5 | 78 |
| 1977 | 55.6 | 80 |
| 1978 | 61.7 | 89 |
| 1979 | 61.9 | 89 |
| 1980 | 69.2 | 100 |
| 1981 | 73.1 | 105 |
| 1982 | 73.3 | 106 |
| 1983 | 77.1 | 111 |
| 1984 | 82.4 | 119 |
| 1985 | 82.5 | 119 |
| 1986 | 82.4 | 119 |
| 1987 | 82.2 | 118 |
| 1988 | 81.9 | 118 |
| 1989 | 83.3 | 120 |
| 1990 | 88.2 | 127 |
| 1991 | 95.2 | 137 |
| 1992 | 95.5 | 138 |
| 1993 | 95.4 | 137 |
| 1994 | 95.0 | 137 |
| 1995 | 94.8 | 137 |
| 1996 | 94.6 | 136 |
| 1997 | 95.8 | 138 |
| 1998 | 95.6 | 138 |
| 1999 | 95.2 | 137 |
| 2000 | 95.5 | 138 |
| 2001 | 92.8 | 134 |
| 2002 | 88.6 | 128 |
| 2003 | 87.2 | 126 |
| 2004 | 86.4 | 124 |
| 2005 | 86.4 | 124 |
| 2006 | 84.7 | 122 |
| 2007 | 84.2 | 121 |
| 2008 | 100.1 | 144 |
| 2009 | 101.0 | 145 |
| 2010 | 100.0 | 144 |
| 2011 | 99.5 | 143 |
| 2012 | 99.2 | 143 |
| 2013 | 98.7 | 142 |
| 2014 | 101.0 | 145 |
The next figure presents the changes in the prices of a 77g pack of instant ramen 1970-2014. (unit: yen)

Source is Statistics Bureau. 消費者物価指数 (CPI) 結果
www.stat.go.jp/data/cpi/historic.htm
www.e-stat.go.jp/SG1/estat/Csvdl.do?sinfid=000011288549
Related Topics