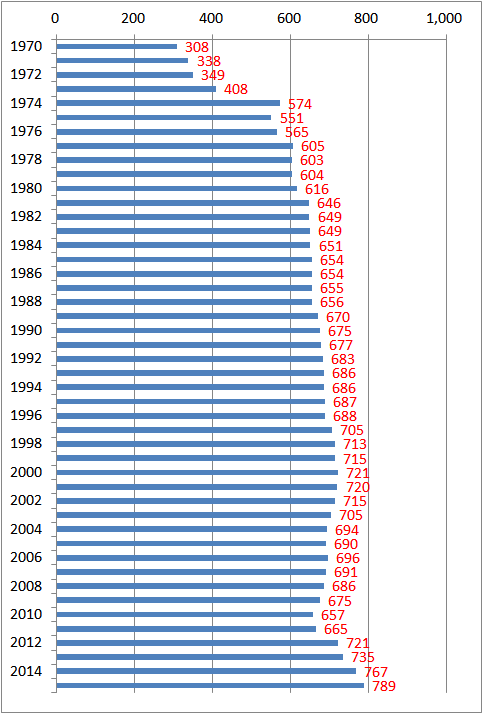
Ministry of Internal Affairs and Communications monitors the price of children's undershirts monthly.
The data below show the changes in the price indexes of children's undershirts between 1970 and 2015, if the price in 2015 is taken as 100.

| Year | Index (2015 = 100) | Price of children's undershirts (yen) |
| 1970 | 39.1 | 308 |
| 1971 | 42.8 | 338 |
| 1972 | 44.2 | 349 |
| 1973 | 51.7 | 408 |
| 1974 | 72.7 | 574 |
| 1975 | 69.8 | 551 |
| 1976 | 71.6 | 565 |
| 1977 | 76.7 | 605 |
| 1978 | 76.4 | 603 |
| 1979 | 76.6 | 604 |
| 1980 | 78.1 | 616 |
| 1981 | 81.9 | 646 |
| 1982 | 82.2 | 649 |
| 1983 | 82.3 | 649 |
| 1984 | 82.5 | 651 |
| 1985 | 82.9 | 654 |
| 1986 | 82.9 | 654 |
| 1987 | 83.0 | 655 |
| 1988 | 83.1 | 656 |
| 1989 | 84.9 | 670 |
| 1990 | 85.5 | 675 |
| 1991 | 85.8 | 677 |
| 1992 | 86.6 | 683 |
| 1993 | 86.9 | 686 |
| 1994 | 87.0 | 686 |
| 1995 | 87.1 | 687 |
| 1996 | 87.2 | 688 |
| 1997 | 89.4 | 705 |
| 1998 | 90.4 | 713 |
| 1999 | 90.6 | 715 |
| 2000 | 91.4 | 721 |
| 2001 | 91.3 | 720 |
| 2002 | 90.6 | 715 |
| 2003 | 89.3 | 705 |
| 2004 | 88.0 | 694 |
| 2005 | 87.5 | 690 |
| 2006 | 88.2 | 696 |
| 2007 | 87.6 | 691 |
| 2008 | 86.9 | 686 |
| 2009 | 85.5 | 675 |
| 2010 | 83.3 | 657 |
| 2011 | 84.3 | 665 |
| 2012 | 91.4 | 721 |
| 2013 | 93.2 | 735 |
| 2014 | 97.2 | 767 |
| 2015 | 100.0 | 789 |

Source is Statistics Bureau. 消費者物価指数 (CPI) 結果
www.stat.go.jp/data/cpi/historic.htm
www.e-stat.go.jp/SG1/estat/Csvdl.do?sinfid=000011288551
Related Topics