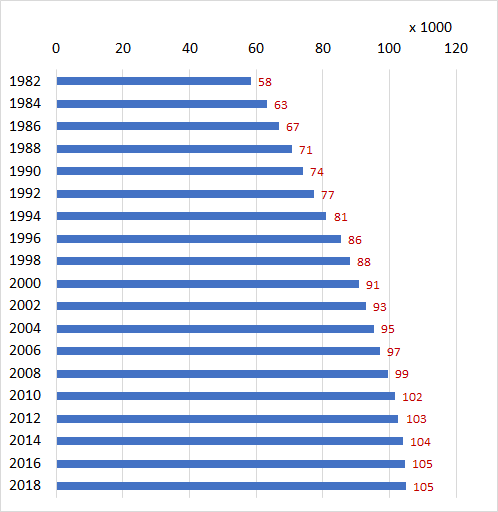
Changes in the Number of Dentists in Japan, 1982-2018
The following data shows the changes in the number of dentist in Japan between 1982 and 2018.
| Year | Dentists | Rate of change(%) | per 100,000 population |
| 1982 | 58,362 | … | 49.2 |
| 1984 | 63,145 | 8.2 | 52.5 |
| 1986 | 66,797 | 5.8 | 54.9 |
| 1988 | 70,572 | 5.7 | 57.5 |
| 1990 | 74,028 | 4.9 | 59.9 |
| 1992 | 77,416 | 4.6 | 62.2 |
| 1994 | 81,055 | 4.7 | 64.8 |
| 1996 | 85,518 | 5.5 | 67.9 |
| 1998 | 88,061 | 3.0 | 69.6 |
| 2000 | 90,857 | 3.2 | 71.6 |
| 2002 | 92,874 | 2.2 | 72.9 |
| 2004 | 95,197 | 2.5 | 74.6 |
| 2006 | 97,198 | 2.1 | 76.1 |
| 2008 | 99,426 | 2.3 | 77.9 |
| 2010 | 101,576 | 2.2 | 79.3 |
| 2012 | 102,551 | 1.0 | 80.4 |
| 2014 | 103,972 | 1.4 | 81.8 |
| 2016 | 104,533 | 0.5 | 82.4 |
| 2018 | 104,908 | 0.4 | 83.0 |
Source is Ministry of Health, Labour and Welfare. 平成30年(2018年)医師・歯科医師・薬剤師統計の概況
www.mhlw.go.jp/toukei/saikin/hw/ishi/18/index.html
www.mhlw.go.jp/toukei/saikin/hw/ishi/18/xls/hyo_H30.xls
Related Topics