GDP of Tokyo in 2013 was 93.1 trillion yen. Japan GDP was 480 trillion yen in 2013.
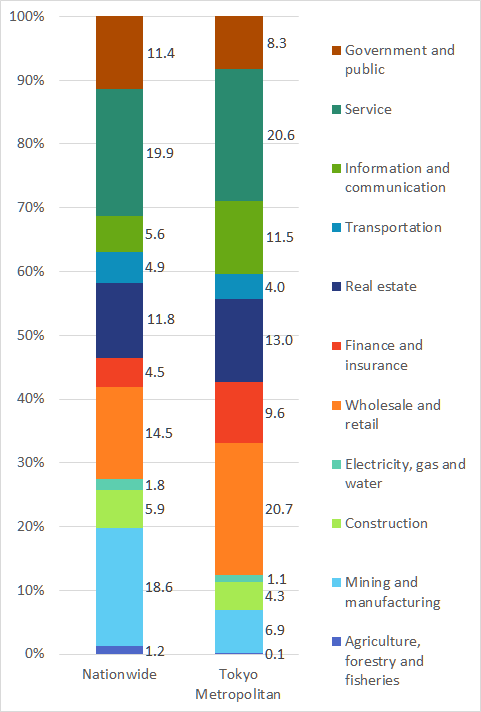
The graph below shows the breakdown of Tokyo GDP and Japan GDP by industry.

In Tokyo, the portions of "wholesale & retail", "Finance", "Real estate", "IT", and "Service" are higher than the nation's average.
| Industry | Nationwide (%) | Tokyo Metropolitan (%) |
| Agriculture, forestry and fisheries | 1.2 | 0.1 |
| Mining and manufacturing | 18.6 | 6.9 |
| Construction | 5.9 | 4.3 |
| Electricity, gas and water | 1.8 | 1.1 |
| Wholesale and retail | 14.5 | 20.7 |
| Finance and insurance | 4.5 | 9.6 |
| Real estate | 11.8 | 13.0 |
| Transportation | 4.9 | 4.0 |
| Information and communication | 5.6 | 11.5 |
| Service | 19.9 | 20.6 |
| Government and public | 11.4 | 8.3 |
Source is a booklet "Kurashi to Tokei 2016" くらしと統計 2016
www.toukei.metro.tokyo.jp/kurasi/2016/ku-12.htm
Related Topics