Last week Ministry of Health, Labour and Welfare reported the 2014 birth rate. According to it, the nation-wide total fertility rate (birth rate) was 1.42. It dropped 0.1 point from 2013.
The total fertility rate of a population is the average number of children that would be born to a woman over her lifetime if:
She was to experience the exact current age-specific fertility rates through her lifetime, and
She was to survive from birth through the end of her reproductive life. (wikipedia)
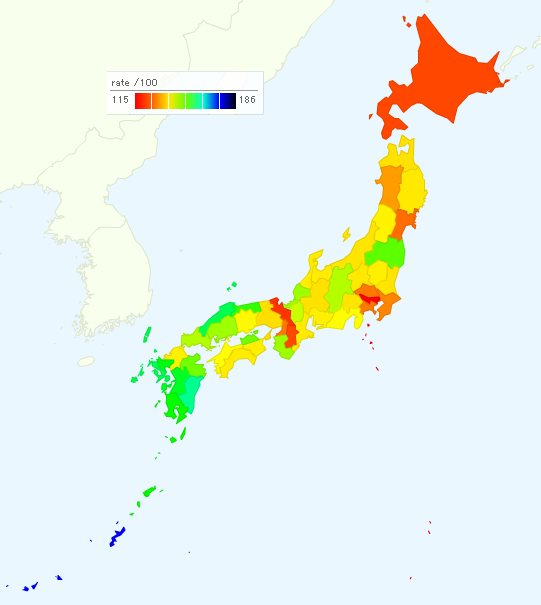
The figure below shows the total fertility rate by prefecture in 2014.

| Prefecture | Rate in 2014 | Rate in 2013 | Change |
| Total | 1.42 | 1.43 | -0.01 |
| Hokkaido | 1.27 | 1.28 | -0.01 |
| Aomori | 1.42 | 1.40 | 0.02 |
| Iwate | 1.44 | 1.46 | -0.02 |
| Miyagi | 1.30 | 1.34 | -0.04 |
| Akita | 1.34 | 1.35 | -0.01 |
| Yamagata | 1.47 | 1.47 | 0.00 |
| Fukushima | 1.58 | 1.53 | 0.05 |
| Ibaraki | 1.43 | 1.42 | 0.01 |
| Tochigi | 1.46 | 1.43 | 0.03 |
| Gunma | 1.44 | 1.41 | 0.03 |
| Saitama | 1.31 | 1.33 | -0.02 |
| Chiba | 1.32 | 1.33 | -0.01 |
| Tokyo | 1.15 | 1.13 | 0.02 |
| Kanagawa | 1.31 | 1.31 | 0.00 |
| Niigata | 1.43 | 1.44 | -0.01 |
| Toyama | 1.45 | 1.43 | 0.02 |
| Ishikawa | 1.45 | 1.49 | -0.04 |
| Fukui | 1.55 | 1.60 | -0.05 |
| Yamanashi | 1.43 | 1.44 | -0.01 |
| Nagano | 1.54 | 1.54 | 0.00 |
| Gifu | 1.42 | 1.45 | -0.03 |
| Shizuoka | 1.50 | 1.53 | -0.03 |
| Aichi | 1.46 | 1.47 | -0.01 |
| Mie | 1.45 | 1.49 | -0.04 |
| Shiga | 1.53 | 1.53 | 0.00 |
| Kyoto | 1.24 | 1.26 | -0.02 |
| Osaka | 1.31 | 1.32 | -0.01 |
| Hyogo | 1.41 | 1.42 | -0.01 |
| Nara | 1.27 | 1.31 | -0.04 |
| Wakayama | 1.55 | 1.52 | 0.03 |
| Tottori | 1.60 | 1.62 | -0.02 |
| Shimane | 1.66 | 1.65 | 0.01 |
| Okayama | 1.49 | 1.49 | 0.00 |
| Hiroshima | 1.55 | 1.57 | -0.02 |
| Yamaguchi | 1.54 | 1.56 | -0.02 |
| Tokushima | 1.46 | 1.43 | 0.03 |
| Kagawa | 1.57 | 1.59 | -0.02 |
| Ehime | 1.50 | 1.52 | -0.02 |
| Kochi | 1.45 | 1.47 | -0.02 |
| Fukuoka | 1.46 | 1.45 | 0.01 |
| Saga | 1.63 | 1.59 | 0.04 |
| Nagasaki | 1.66 | 1.64 | 0.02 |
| Kumamoto | 1.64 | 1.65 | -0.01 |
| Oita | 1.57 | 1.56 | 0.01 |
| Miyazaki | 1.69 | 1.72 | -0.03 |
| Kagoshima | 1.62 | 1.63 | -0.01 |
| Okinawa | 1.86 | 1.94 | -0.08 |
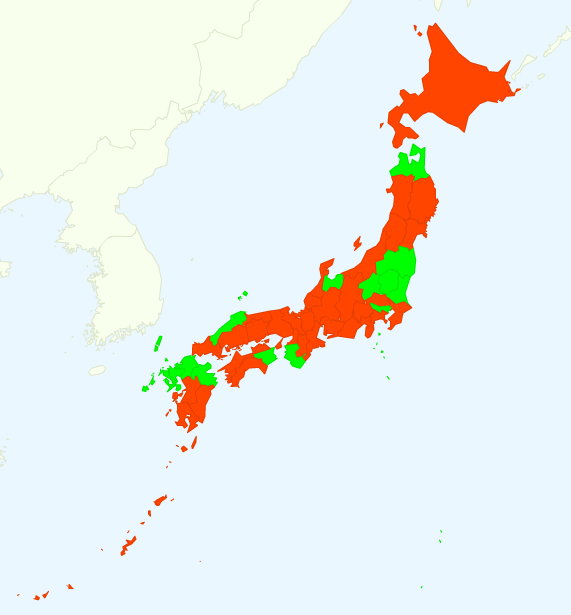
The following figure shows the changes in the total fertility rate between 2013 and 2014. The rate increased in green prefectures and it decreased in oreange prefectures.

Source is Ministry of Health, Labour and Welfare.
www.mhlw.go.jp/toukei/saikin/hw/jinkou/geppo/nengai14/dl/gaikyou26.pdf
Related Topics