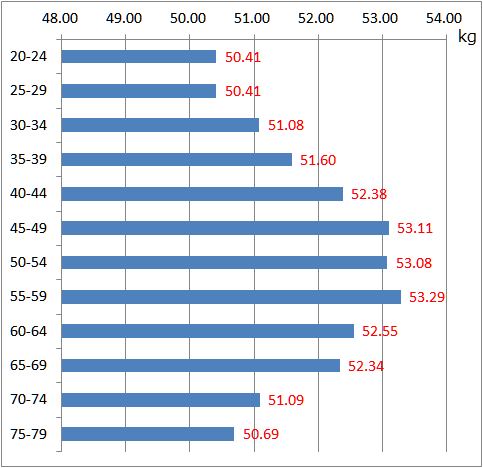
Ministry of Education, Culture, Sports, Science and Technology released 2014 data of the average weight of Japanese woman. The following table shows it.
Table : Average Weight of Japanese Women, 2014
| Age | Number of sample | Weight (kg) | lb | Stone |
| 20-24 | 1007 | 50.41 | 111.14 | 7.94 |
| 25-29 | 988 | 50.41 | 111.14 | 7.94 |
| 30-34 | 1058 | 51.08 | 112.61 | 8.04 |
| 35-39 | 1278 | 51.60 | 113.76 | 8.12 |
| 40-44 | 1327 | 52.38 | 115.48 | 8.25 |
| 45-49 | 1256 | 53.11 | 117.09 | 8.36 |
| 50-54 | 1192 | 53.08 | 117.02 | 8.36 |
| 55-59 | 1217 | 53.29 | 117.48 | 8.39 |
| 60-64 | 1423 | 52.55 | 115.85 | 8.28 |
| 65-69 | 897 | 52.34 | 115.39 | 8.24 |
| 70-74 | 884 | 51.09 | 112.63 | 8.05 |
| 75-79 | 861 | 50.69 | 111.75 | 7.98 |


Source is Ministry of Education, Culture, Sports, Science and Technology. 体力・運動能力調査
www.mext.go.jp/b_menu/toukei/chousa04/tairyoku/1261241.htm
www.e-stat.go.jp/SG1/estat/List.do?bid=000001054955&cycode=0
Related Topics