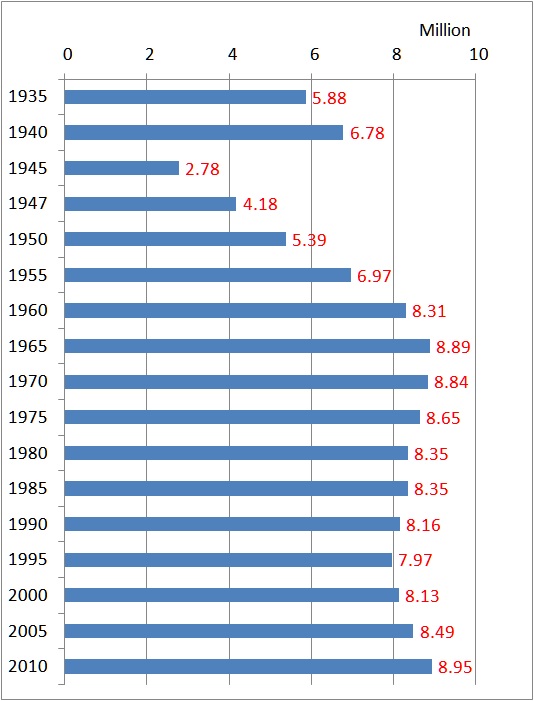
Changes in Population of Tokyo 23 Wards, 1935-2010
Tokyo 23 Wards area has 621 km2. Currently 9 million people live in there, including myself. The below shows the changes in population of Tokyo 23 wards from 1935 to 2010.
Figure : Changes in Population of Tokyo 23 Wards, 1935-2010

| Year | Population | Men | Women | Gender ratio (Women=100) | Members per household | Population density (/1km2) |
| 1935 | 5,875,667 | 3,076,217 | 2,799,450 | 110 | 4.93 | 10667 |
| 1940 | 6,778,804 | 3,494,890 | 3,283,914 | 106 | 4.72 | 11834 |
| 1945 | 2,777,010 | 1,439,928 | 1,337,082 | 108 | No data | 4799 |
| 1947 | 4,177,548 | 2,133,478 | 2,044,070 | 104 | 4.00 | 7219 |
| 1950 | 5,385,071 | 2,720,794 | 2,664,277 | 102 | 4.29 | 9306 |
| 1955 | 6,969,104 | 3,576,299 | 3,392,805 | 105 | 4.42 | 12237 |
| 1960 | 8,310,027 | 4,304,609 | 4,005,418 | 108 | 3.82 | 14592 |
| 1965 | 8,893,094 | 4,559,233 | 4,333,861 | 105 | 3.44 | 15559 |
| 1970 | 8,840,942 | 4,488,745 | 4,352,197 | 103 | 3.09 | 15320 |
| 1975 | 8,646,520 | 4,365,969 | 4,280,551 | 102 | 2.82 | 14882 |
| 1980 | 8,351,893 | 4,189,836 | 4,162,057 | 101 | 2.58 | 14109 |
| 1985 | 8,354,615 | 4,182,975 | 4,171,640 | 100 | 2.52 | 13973 |
| 1990 | 8,163,573 | 4,081,658 | 4,081,915 | 100 | 2.38 | 13214 |
| 1995 | 7,967,614 | 3,959,416 | 4,008,198 | 99 | 2.27 | 12827 |
| 2000 | 8,134,688 | 4,044,026 | 4,090,662 | 99 | 2.13 | 13090 |
| 2005 | 8,489,653 | 4,210,749 | 4,278,904 | 98 | 2.05 | 13660 |
| 2010 | 8,945,695 | 4,412,050 | 4,533,645 | 97 | 1.97 | 14383 |
Source is City of Yokohama. 大都市比較統計年表
www.city.yokohama.lg.jp/ex/stat/daitoshi/
www.city.yokohama.lg.jp/ex/stat/daitoshi/h24/data/h020100.xls
Related Topics