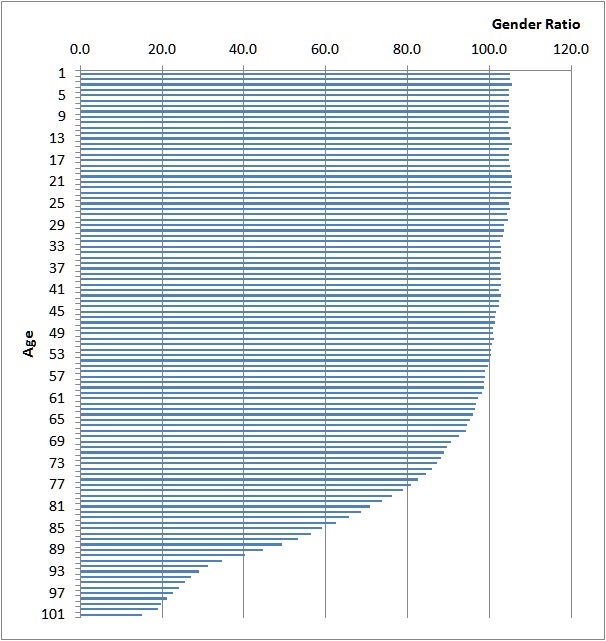
In terms of newborns, the number of boy babies is larger than girl babies, and the gender (sex) ratio is 105 (boys:girls=105:100). The death rate of men is bigger than women's. So around age 50, the sex ratio becomes 100. Over 50, the women's population is bigger than men's.
Figure : Gender Ratio by Age in Japan in 2013

| Age | Gerder (sex) ratio |
| Total | 94.7 |
| 0 | 105.1 |
| 1 | 105.0 |
| 2 | 105.6 |
| 3 | 104.9 |
| 4 | 104.7 |
| 5 | 104.7 |
| 6 | 104.9 |
| 7 | 104.8 |
| 8 | 104.9 |
| 9 | 104.6 |
| 10 | 105.2 |
| 11 | 104.9 |
| 12 | 105.1 |
| 13 | 105.5 |
| 14 | 104.9 |
| 15 | 104.8 |
| 16 | 104.7 |
| 17 | 105.1 |
| 18 | 105.2 |
| 19 | 105.5 |
| 20 | 105.3 |
| 21 | 105.5 |
| 22 | 105.4 |
| 23 | 105.4 |
| 24 | 104.9 |
| 25 | 105.0 |
| 26 | 104.4 |
| 27 | 104.5 |
| 28 | 103.6 |
| 29 | 103.5 |
| 30 | 103.3 |
| 31 | 102.7 |
| 32 | 102.9 |
| 33 | 102.8 |
| 34 | 102.9 |
| 35 | 102.7 |
| 36 | 102.7 |
| 37 | 102.9 |
| 38 | 102.9 |
| 39 | 102.9 |
| 40 | 102.4 |
| 41 | 102.8 |
| 42 | 102.3 |
| 43 | 102.3 |
| 44 | 101.6 |
| 45 | 101.4 |
| 46 | 101.5 |
| 47 | 100.9 |
| 48 | 100.9 |
| 49 | 101.2 |
| 50 | 100.6 |
| 51 | 100.4 |
| 52 | 100.3 |
| 53 | 100.0 |
| 54 | 99.6 |
| 55 | 99.0 |
| 56 | 98.9 |
| 57 | 98.7 |
| 58 | 98.6 |
| 59 | 98.1 |
| 60 | 97.2 |
| 61 | 96.7 |
| 62 | 96.4 |
| 63 | 95.9 |
| 64 | 95.3 |
| 65 | 94.6 |
| 66 | 94.3 |
| 67 | 92.7 |
| 68 | 90.7 |
| 69 | 89.7 |
| 70 | 89.0 |
| 71 | 88.2 |
| 72 | 87.3 |
| 73 | 85.9 |
| 74 | 84.5 |
| 75 | 82.5 |
| 76 | 80.8 |
| 77 | 78.8 |
| 78 | 76.3 |
| 79 | 73.7 |
| 80 | 70.8 |
| 81 | 68.6 |
| 82 | 65.6 |
| 83 | 62.6 |
| 84 | 59.1 |
| 85 | 56.4 |
| 86 | 53.2 |
| 87 | 49.2 |
| 88 | 44.6 |
| 89 | 40.2 |
| 90 | 34.6 |
| 91 | 31.3 |
| 92 | 28.9 |
| 93 | 27.1 |
| 94 | 25.7 |
| 95 | 24.0 |
| 96 | 22.7 |
| 97 | 21.1 |
| 98 | 19.6 |
| 99 | 19.1 |
| 100 | 15.1 |
Source is Statistics Bureau.
www.stat.go.jp/data/jinsui/2013np/
www.stat.go.jp/data/jinsui/2013np/zuhyou/05k25-2.xls
Related Topics