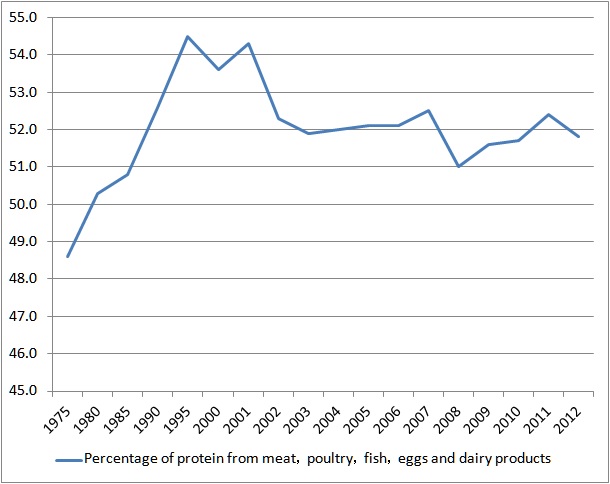
In Japan, like calorie intake, protein intake is also in decreasing trend. The average daily protein intake in 1975 was 80 grams per capita, and it decreased to 68 grams in 2012. Please see the following data reported by Ministry of Health, Labour and Welfare.
Figure : Trend in Protein Intake of Japanese People,1975 to 2012, per day per capita (unit : gram)

| Protein intake | |||
| Year | Total (g) | Meat,poultry,fish,eggs and dairy products (g) | Percentage of protein from meat,poultry,fish,eggs and dairy products (%) |
| 1975 | 80.0 | 38.9 | 48.6 |
| 1980 | 77.9 | 39.2 | 50.3 |
| 1985 | 79.0 | 40.1 | 50.8 |
| 1990 | 78.7 | 41.4 | 52.6 |
| 1995 | 81.5 | 44.4 | 54.5 |
| 2000 | 77.7 | 41.7 | 53.6 |
| 2001 | 73.4 | 39.9 | 54.3 |
| 2002 | 72.2 | 39.0 | 52.3 |
| 2003 | 71.5 | 38.3 | 51.9 |
| 2004 | 70.8 | 38.0 | 52.0 |
| 2005 | 71.1 | 38.3 | 52.1 |
| 2006 | 69.8 | 37.5 | 52.1 |
| 2007 | 69.8 | 38.0 | 52.5 |
| 2008 | 68.1 | 36.1 | 51.0 |
| 2009 | 67.8 | 36.3 | 51.6 |
| 2010 | 67.3 | 36.0 | 51.7 |
| 2011 | 67.0 | 36.4 | 52.4 |
| 2012 | 68.0 | 36.4 | 51.8 |
Percentage of animal-derived protein has not increased in the last two decades.

Source is Ministry of Health, Labour and Welfare.
www.e-stat.go.jp/SG1/estat/GL08020103.do?_toGL08020103_&listID=000001118468&requestSender=estat
www.e-stat.go.jp/SG1/estat/GL08020103.do?_xlsDownload_&fileId=000006864461&releaseCount=1
Related Topics