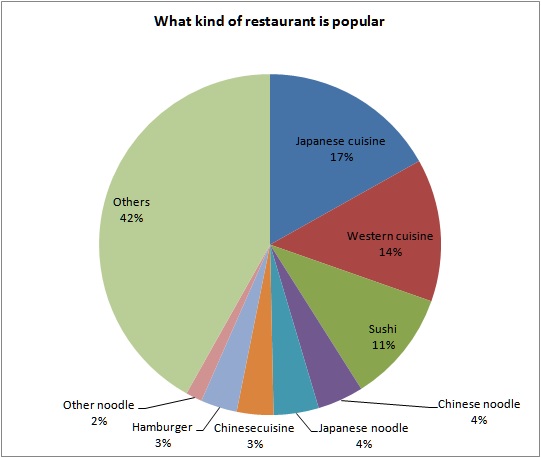
The following table presents for which type of restaurant Japanese people spent money. Unit is yen. It is the yearly average figure from 2011 to 2013. The survey was conducted by the Japanese government and target people were families which consist of more than two members. So this data does not include single households.
Japanese people spend the largest amount of money to Japanese cuisine restaurants. In terms of frequency, Japanese cuisine restaurant is the top also.
The unit price of Sushi is expensive, and Sushi restaurants get a high figure in the statistics with fewer visits. The unit price of noodles and hamburger are relatively cheap.
I go noodles' restaurants more often.
| Type of restaurant | Spent money (yen) | $ | Euro |
| Japanese noodle (Soba, Udon) | 5,376 | 54 | 38 |
| Chinese noodle (Ramen) | 5,492 | 55 | 39 |
| Other noodle | 1,949 | 19 | 14 |
| Sushi | 13,387 | 134 | 95 |
| Japanese cuisine | 21,197 | 212 | 150 |
| Chinese cuisine | 4,371 | 44 | 31 |
| Western cuisine | 16,971 | 170 | 120 |
| Hamburger | 4,329 | 43 | 31 |
| Others | 52,594 | 526 | 373 |

Source is Statistics Bureau, Ministry of Internal Affairs and Communications.
www.stat.go.jp/data/kakei/zuhyou/rank13.xls
www.stat.go.jp/data/kakei/5.htm
Related Topics