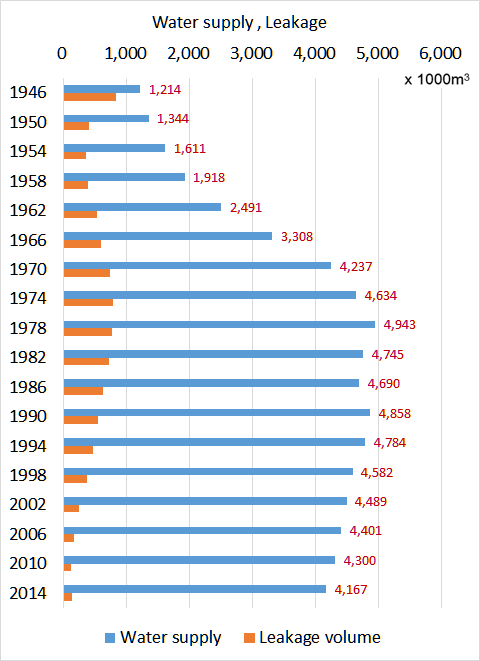
The following data show the amount of the annual water supply in Tokyo from 1946 to 2014.

| Water supply | Leakage volume | Leakage rate (%) | |
| 1946 | 1,214 | 826 | 68.0 |
| 1950 | 1,344 | 403 | 30.0 |
| 1954 | 1,611 | 354 | 22.0 |
| 1958 | 1,918 | 384 | 20.0 |
| 1962 | 2,491 | 523 | 21.0 |
| 1966 | 3,308 | 592 | 17.9 |
| 1970 | 4,237 | 729 | 17.2 |
| 1974 | 4,634 | 779 | 16.8 |
| 1978 | 4,943 | 772 | 15.6 |
| 1982 | 4,745 | 714 | 15.0 |
| 1986 | 4,690 | 620 | 13.2 |
| 1990 | 4,858 | 537 | 11.1 |
| 1994 | 4,784 | 461 | 9.6 |
| 1998 | 4,582 | 364 | 8.0 |
| 2002 | 4,489 | 243 | 5.4 |
| 2006 | 4,401 | 160 | 3.6 |
| 2010 | 4,300 | 116 | 2.7 |
| 2014 | 4,167 | 128 | 3.1 |
Source is a booklet "Kurashi to Tokei 2016" くらしと統計 2016
www.toukei.metro.tokyo.jp/kurasi/2016/ku-16.htm
Related Topics