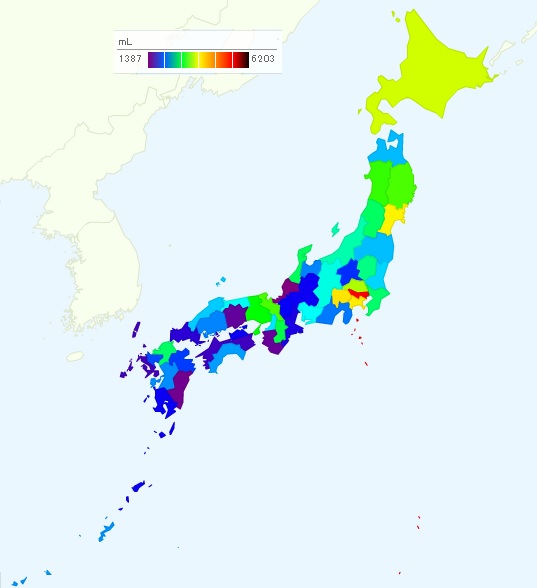
Consumption of Wine by City in Japan
The following table shows yearly consumption of wine per capita by city in Japan. Unit is mL. It is the average figure from 2010 to 2012. People in Tokyo drink wine most. Rank No.2 Kofu is a leading producer of wine.
| Wine (mL) | |
| Tokyo | 6,203 |
| Kofu | 4,593 |
| Yokohama | 4,461 |
| Sendai | 4,316 |
| Kawasaki | 4,180 |
| Sapporo | 4,016 |
| Saitama | 3,918 |
| Kyoto | 3,654 |
| Morioka | 3,649 |
| Akita | 3,592 |
| Kobe | 3,451 |
| Nara | 3,260 |
| Kanazawa | 3,204 |
| Yamagata | 3,187 |
| Fukuoka | 3,178 |
| Chiba | 3,168 |
| Utsunomiya | 3,100 |
| Niigata | 2,985 |
| Kitakyushu | 2,868 |
| Nagano | 2,841 |
| Tottori | 2,794 |
| Nagoya | 2,778 |
| Osaka | 2,699 |
| Mito | 2,653 |
| Matsue | 2,627 |
| Fukushima | 2,589 |
| Aomori | 2,580 |
| Kochi | 2,506 |
| Naha | 2,478 |
| Kumamoto | 2,459 |
| Hiroshima | 2,436 |
| Toyama | 2,429 |
| Shizuoka | 2,400 |
| Saga | 2,282 |
| Oita | 2,237 |
| Maebashi | 2,198 |
| Otsu | 2,036 |
| Kagoshima | 2,017 |
| Gifu | 2,011 |
| Takamatsu | 2,011 |
| Tsu | 1,927 |
| Yamaguchi | 1,844 |
| Hamamatsu | 1,841 |
| Matsuyama | 1,747 |
| Tokushima | 1,735 |
| Nagasaki | 1,706 |
| Sakai | 1,670 |
| Okayama | 1,543 |
| Wakayama | 1,518 |
| Miyazaki | 1,467 |
| Fukui | 1,387 |


Source is Statistics Bureau, Ministry of Internal Affairs and Communications.
www.stat.go.jp/data/kakei/zuhyou/rank12.xls
Related Topics