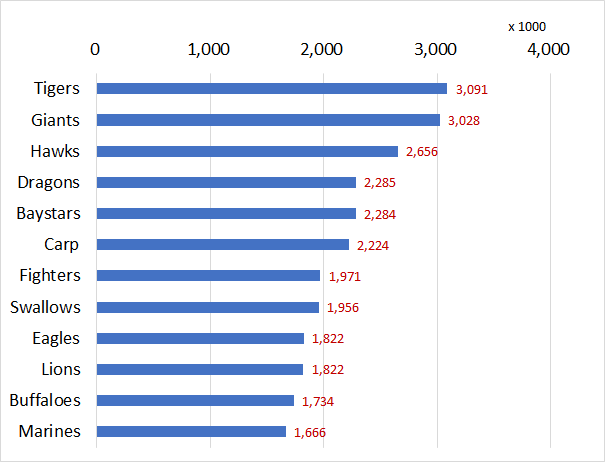
2019 Season Attendance Figures of NPB (Japan Professional Baseball)
The table below shows 2019 season's attendance figures of NPB.
The figure means the number of sold tickets. It includes someone who did not show up at the game in despite of having a ticket. So announced number does not mean actual number of guests. The actual number may be less than the below.
Central league:
Total Attendees: 14,867,071
Average Attendees per Game: 34,655
Pacific league:
Total Attendees: 11,669,891
Average Attendees per Game: 27,203
Table: 2019 Season Attendance Figures by Team
| Pacific league | |||||
| Season standing | Team | Franchise place | Total Attendees | Host games | Attendee per game |
| 1 | Saitama Seibu Lions | Tokorozawa | 1,821,519 | 72 | 25,299 |
| 2 | Fukuoka Softbank Hawks | Fukuoka | 2,656,182 | 72 | 36,891 |
| 3 | Tohoku Rakuten Golden Eagles | Sendai | 1,821,785 | 71 | 25,659 |
| 4 | Chiba Lotte Marines | Chiba | 1,665,891 | 71 | 23,463 |
| 5 | Hokkaido Nippon-Ham Fighters | Sapporo | 1,970,516 | 72 | 27,368 |
| 6 | Orix Buffaloes | Osaka | 1,733,998 | 71 | 24,423 |
| Central league | |||||
| Season standing | Team | Franchise place | Total Attendees | Host games | Attendee per game |
| 1 | Yomiuri Giants | Tokyo | 3,027,682 | 71 | 42,643 |
| 2 | DeNA Baystars | Yokohama | 2,283,524 | 72 | 31,716 |
| 3 | Hanshin Tigers | Nishinomiya | 3,091,335 | 72 | 42,935 |
| 4 | Hiroshima Toyo Carp | Hiroshima | 2,223,619 | 71 | 31,319 |
| 5 | Chunichi Dragons | Nagoya | 2,285,333 | 72 | 31,741 |
| 6 | Yakult Swallows | Tokyo | 1,955,578 | 71 | 27,543 |

Source is Nippon Professional Baseball Organization.
www.npb.or.jp/statistics/
Related Topics
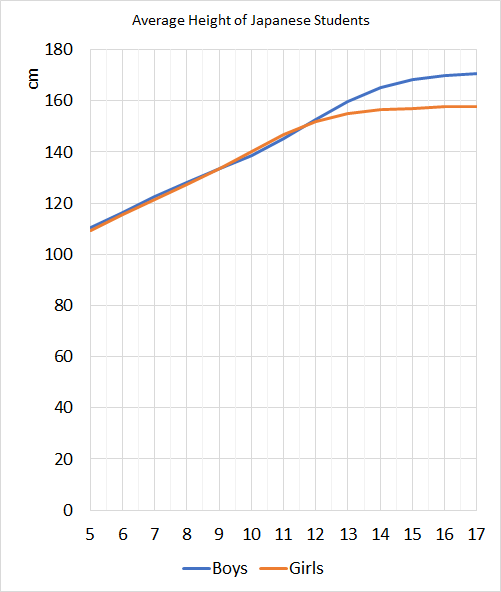
Average Height of Japanese Students, 2017
In every April, students are measured their heights and weights at school. The government collects those data and publishes them each year. The following shows the data of 2017.
Table 1: Average Height of Japanese Male Students, 2017
| Age | Hight cm | Hight ft. |
| 5 | 110.3 | 3' 7" |
| 6 | 116.5 | 3' 10" |
| 7 | 122.5 | 4' 0" |
| 8 | 128.1 | 4' 2" |
| 9 | 133.7 | 4' 5" |
| 10 | 138.8 | 4' 7" |
| 11 | 145.2 | 4' 9" |
| 12 | 152.7 | 5' 0" |
| 13 | 159.8 | 5' 3" |
| 14 | 165.3 | 5' 5" |
| 15 | 168.4 | 5' 6" |
| 16 | 169.9 | 5' 7" |
| 17 | 170.6 | 5' 7" |
Table 2: Average Height of Japanese Female Students, 2017
| Age | Hight cm | Hight ft. |
| 5 | 109.4 | 3' 7" |
| 6 | 115.6 | 3' 10" |
| 7 | 121.5 | 3' 12" |
| 8 | 127.3 | 4' 2" |
| 9 | 133.4 | 4' 5" |
| 10 | 140.1 | 4' 7" |
| 11 | 146.8 | 4' 10" |
| 12 | 151.9 | 4' 12" |
| 13 | 154.9 | 5' 1" |
| 14 | 156.6 | 5' 2" |
| 15 | 157.1 | 5' 2" |
| 16 | 157.6 | 5' 2" |
| 17 | 157.8 | 5' 2" |

Source is Source is Ministry of Education, Culture, Sports, Science and Technology. 学校保健統計調査
www.e-stat.go.jp/stat-search/files?page=1&layout=datalist&toukei=00400002&tstat=000001011648&cycle=0&tclass1=000001127520&tclass2=000001127522
www.e-stat.go.jp/stat-search/file-download?statInfId=000031812089&fileKind=0
Related Topics
Percentage of Air Conditioned Classrooms in Japan, 2019
Ministry of Education, Culture, Sports, Science and Technology reported the percentage of school classrooms which have air conditioners.
The following data show the detail of those. The data cover only public schools (run by public governments), and does not include the statistics of private schools.
Table 1: Numer of classrooms air-conditioned, in elementary school and junior high school, 2019
| Number of class rooms | with air conditioner | air-conditioned rate | |
| Hokkaido | 35,420 | 835 | 2.40% |
| Aomori | 10,552 | 660 | 6.30% |
| Iwate | 10,305 | 1,509 | 14.60% |
| Miyagi | 15,710 | 4,351 | 27.70% |
| Akita | 7,074 | 1,265 | 17.90% |
| Yamagata | 7,833 | 3,661 | 46.70% |
| Fukushima | 13,372 | 9,273 | 69.30% |
| Ibaraki | 18,213 | 14,765 | 81.10% |
| Tochigi | 13,354 | 9,193 | 68.80% |
| Gunma | 13,889 | 10,220 | 73.60% |
| Saitama | 38,366 | 29,954 | 78.10% |
| Chiba | 32,971 | 20,027 | 60.70% |
| Tokyo | 57,892 | 54,402 | 94.00% |
| Kanagawa | 42,477 | 33,290 | 78.40% |
| Niigata | 16,651 | 8,992 | 54.00% |
| Toyama | 7,301 | 4,216 | 57.70% |
| Ishikawa | 7,597 | 4,556 | 60.00% |
| Fukui | 6,312 | 4,279 | 67.80% |
| Yamanashi | 5,873 | 4,169 | 71.00% |
| Nagano | 15,418 | 5,851 | 37.90% |
| Gifu | 15,118 | 10,606 | 70.20% |
| Shizuoka | 21,608 | 7,854 | 36.30% |
| Aichi | 44,135 | 27,319 | 61.90% |
| Mie | 12,210 | 7,945 | 65.10% |
| Shiga | 9,562 | 8,987 | 94.00% |
| Kyoto | 15,901 | 12,836 | 80.70% |
| Osaka | 43,360 | 35,893 | 82.80% |
| Hyogo | 31,912 | 22,652 | 71.00% |
| Nara | 8,958 | 7,243 | 80.90% |
| Wakayama | 7,334 | 5,193 | 70.80% |
| Tottori | 4,273 | 2,264 | 53.00% |
| Shimane | 6,378 | 3,861 | 60.50% |
| Okayama | 13,588 | 6,453 | 47.50% |
| Hiroshima | 18,715 | 9,759 | 52.10% |
| Yamaguchi | 10,595 | 4,359 | 41.10% |
| Tokushima | 5,445 | 4,002 | 73.50% |
| Kagawa | 6,281 | 5,968 | 95.00% |
| Ehime | 9,745 | 5,016 | 51.50% |
| Kochi | 5,710 | 2,941 | 51.50% |
| Fukuoka | 30,582 | 22,145 | 72.40% |
| Saga | 6,425 | 4,357 | 67.80% |
| Nagasaki | 10,526 | 4,668 | 44.30% |
| Kumamoto | 12,141 | 8,957 | 73.80% |
| Oita | 7,812 | 6,006 | 76.90% |
| Miyazaki | 7,984 | 3,511 | 44.00% |
| Kagoshima | 13,494 | 6,422 | 47.60% |
| Okinawa | 10,210 | 8,923 | 87.40% |
| Nationwide | 766,582 | 481,608 | 62.80% |

Table 2: Numer of classrooms air-conditioned, in senior high school, 2019
| Number of class rooms | with air conditioner | air-conditioned rate | |
| Hokkaido | 9,489 | 396 | 4.20% |
| Aomori | 2,633 | 195 | 7.40% |
| Iwate | 3,185 | 344 | 10.80% |
| Miyagi | 3,728 | 765 | 20.50% |
| Akita | 2,600 | 604 | 23.20% |
| Yamagata | 2,179 | 652 | 29.90% |
| Fukushima | 3,605 | 1,956 | 54.30% |
| Ibaraki | 4,698 | 2,701 | 57.50% |
| Tochigi | 2,918 | 1,424 | 48.80% |
| Gunma | 3,056 | 1,825 | 59.70% |
| Saitama | 9,818 | 6,589 | 67.10% |
| Chiba | 6,682 | 4,610 | 69.00% |
| Tokyo | 10,680 | 8,822 | 82.60% |
| Kanagawa | 9,348 | 7,697 | 82.30% |
| Niigata | 4,195 | 2,103 | 50.10% |
| Toyama | 2,115 | 993 | 47.00% |
| Ishikawa | 2,150 | 1,320 | 61.40% |
| Fukui | 1,653 | 1,132 | 68.50% |
| Yamanashi | 2,026 | 1,100 | 54.30% |
| Nagano | 3,708 | 1,094 | 29.50% |
| Gifu | 3,738 | 2,401 | 64.20% |
| Shizuoka | 4,984 | 2,390 | 48.00% |
| Aichi | 10,273 | 6,520 | 63.50% |
| Mie | 2,989 | 1,943 | 65.00% |
| Shiga | 2,348 | 1,956 | 83.30% |
| Kyoto | 2,679 | 2,116 | 79.00% |
| Osaka | 9,319 | 6,530 | 70.10% |
| Hyogo | 7,692 | 4,333 | 56.30% |
| Nara | 1,971 | 1,229 | 62.40% |
| Wakayama | 2,578 | 1,741 | 67.50% |
| Tottori | 1,350 | 930 | 68.90% |
| Shimane | 2,014 | 1,143 | 56.80% |
| Okayama | 3,692 | 2,392 | 64.80% |
| Hiroshima | 5,562 | 3,125 | 56.20% |
| Yamaguchi | 3,445 | 1,501 | 43.60% |
| Tokushima | 1,921 | 1,350 | 70.30% |
| Kagawa | 1,821 | 1,392 | 76.40% |
| Ehime | 2,669 | 1,381 | 51.70% |
| Kochi | 2,030 | 1,373 | 67.60% |
| Fukuoka | 6,232 | 4,346 | 69.70% |
| Saga | 1,876 | 916 | 48.80% |
| Nagasaki | 2,722 | 1,440 | 52.90% |
| Kumamoto | 3,474 | 2,227 | 64.10% |
| Oita | 2,296 | 1,321 | 57.50% |
| Miyazaki | 2,225 | 1,260 | 56.60% |
| Kagoshima | 3,246 | 2,178 | 67.10% |
| Okinawa | 3,653 | 3,286 | 90.00% |
| Nationwide | 189,265 | 109,042 | 57.60% |

Source is Ministry of Education, Culture, Sports, Science and Technology. 公立学校施設の空調(冷房)設備の設置状況について
www.mext.go.jp/b_menu/houdou/31/09/__icsFiles/afieldfile/2019/09/19/1421285_1.pdf
Related Topics