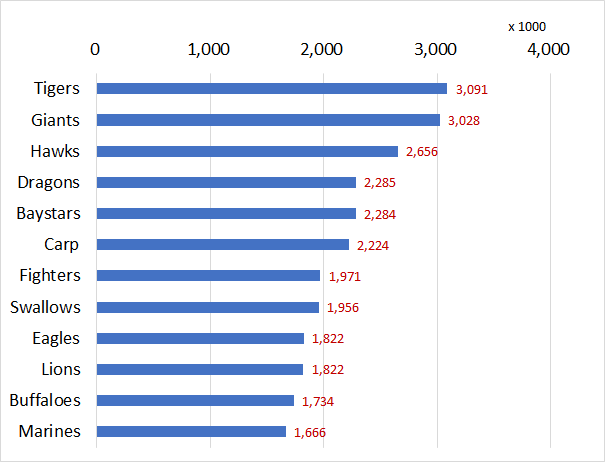
2019 Season Attendance Figures of NPB (Japan Professional Baseball)
The table below shows 2019 season's attendance figures of NPB.
The figure means the number of sold tickets. It includes someone who did not show up at the game in despite of having a ticket. So announced number does not mean actual number of guests. The actual number may be less than the below.
Central league:
Total Attendees: 14,867,071
Average Attendees per Game: 34,655
Pacific league:
Total Attendees: 11,669,891
Average Attendees per Game: 27,203
Table: 2019 Season Attendance Figures by Team
| Pacific league | |||||
| Season standing | Team | Franchise place | Total Attendees | Host games | Attendee per game |
| 1 | Saitama Seibu Lions | Tokorozawa | 1,821,519 | 72 | 25,299 |
| 2 | Fukuoka Softbank Hawks | Fukuoka | 2,656,182 | 72 | 36,891 |
| 3 | Tohoku Rakuten Golden Eagles | Sendai | 1,821,785 | 71 | 25,659 |
| 4 | Chiba Lotte Marines | Chiba | 1,665,891 | 71 | 23,463 |
| 5 | Hokkaido Nippon-Ham Fighters | Sapporo | 1,970,516 | 72 | 27,368 |
| 6 | Orix Buffaloes | Osaka | 1,733,998 | 71 | 24,423 |
| Central league | |||||
| Season standing | Team | Franchise place | Total Attendees | Host games | Attendee per game |
| 1 | Yomiuri Giants | Tokyo | 3,027,682 | 71 | 42,643 |
| 2 | DeNA Baystars | Yokohama | 2,283,524 | 72 | 31,716 |
| 3 | Hanshin Tigers | Nishinomiya | 3,091,335 | 72 | 42,935 |
| 4 | Hiroshima Toyo Carp | Hiroshima | 2,223,619 | 71 | 31,319 |
| 5 | Chunichi Dragons | Nagoya | 2,285,333 | 72 | 31,741 |
| 6 | Yakult Swallows | Tokyo | 1,955,578 | 71 | 27,543 |

Source is Nippon Professional Baseball Organization.
www.npb.or.jp/statistics/
Related Topics