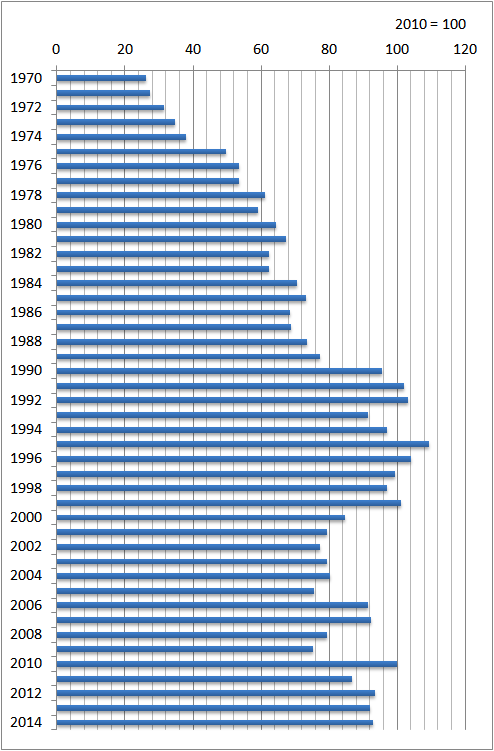
Ministry of Internal Affairs and Communications monitors the price of pear monthly.
The data below show the changes in the price indexes of pear between 1970 and 2014, if the price in 2010 is taken as 100.

| Year | Index (2010 = 100) | Price of 1kg pears (yen) |
| 1970 | 26.1 | 148 |
| 1971 | 27.3 | 155 |
| 1972 | 31.6 | 179 |
| 1973 | 34.7 | 197 |
| 1974 | 38 | 215 |
| 1975 | 49.7 | 282 |
| 1976 | 53.5 | 303 |
| 1977 | 53.6 | 304 |
| 1978 | 61.2 | 347 |
| 1979 | 59.1 | 335 |
| 1980 | 64.5 | 366 |
| 1981 | 67.4 | 382 |
| 1982 | 62.4 | 354 |
| 1983 | 62.2 | 353 |
| 1984 | 70.5 | 400 |
| 1985 | 73.1 | 414 |
| 1986 | 68.5 | 388 |
| 1987 | 68.9 | 391 |
| 1988 | 73.5 | 417 |
| 1989 | 77.2 | 438 |
| 1990 | 95.5 | 541 |
| 1991 | 102 | 578 |
| 1992 | 103.3 | 586 |
| 1993 | 91.5 | 519 |
| 1994 | 97.1 | 551 |
| 1995 | 109.5 | 621 |
| 1996 | 104 | 590 |
| 1997 | 99.5 | 564 |
| 1998 | 97.1 | 551 |
| 1999 | 101 | 573 |
| 2000 | 84.7 | 480 |
| 2001 | 79.3 | 450 |
| 2002 | 77.4 | 439 |
| 2003 | 79.3 | 450 |
| 2004 | 80.4 | 456 |
| 2005 | 75.7 | 429 |
| 2006 | 91.4 | 518 |
| 2007 | 92.3 | 523 |
| 2008 | 79.5 | 451 |
| 2009 | 75.2 | 426 |
| 2010 | 100 | 567 |
| 2011 | 86.6 | 491 |
| 2012 | 93.5 | 530 |
| 2013 | 92 | 522 |
| 2014 | 92.9 | 527 |
The next graph shows the changes in 1 kg pears price from 1970 to 2014.

Source is Statistics Bureau. 消費者物価指数 (CPI) 結果
www.stat.go.jp/data/cpi/historic.htm
www.e-stat.go.jp/SG1/estat/Csvdl.do?sinfid=000011288549
Related Topics