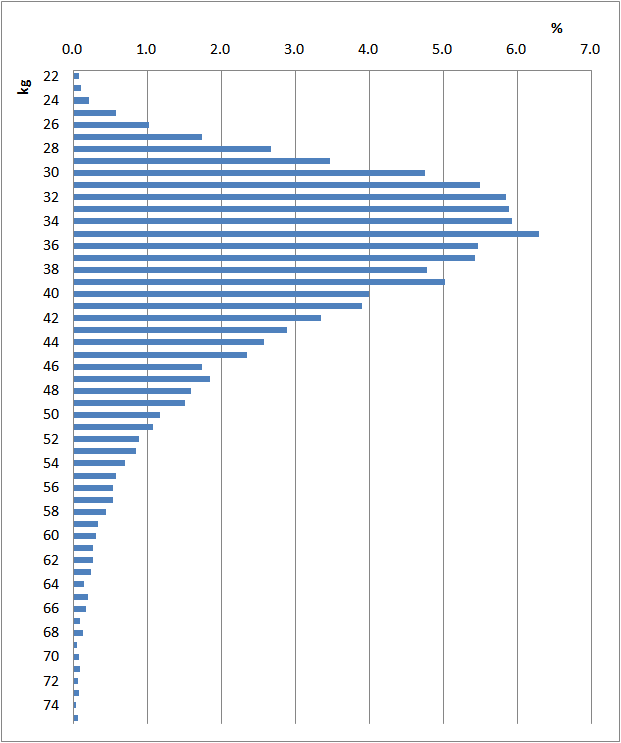
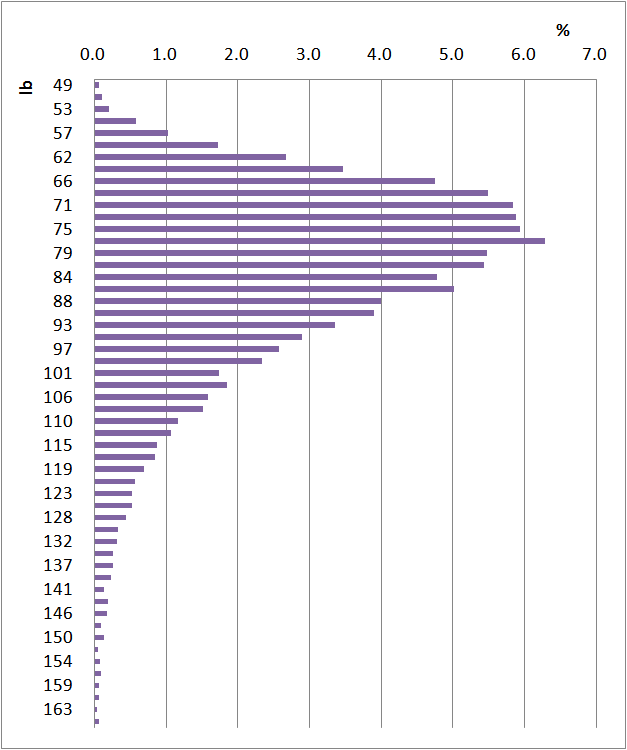
Distribution of 11 Year-old Boys' Weights in Japan, 2015
In every April, students are measured their heights and weights at school. The government collects those data and publishes them each year. Here are the 2015 data on the distribution of 11 year-old boys' weights.
Figure: Distribution of 11 Year-old Boys' Weights in Japan, 2015


| kg | lb | % |
| 15 | 33 | 0.0 |
| 16 | 35 | 0.0 |
| 17 | 37 | 0.0 |
| 18 | 40 | 0.0 |
| 19 | 42 | 0.0 |
| 20 | 44 | 0.0 |
| 21 | 46 | 0.0 |
| 22 | 49 | 0.1 |
| 23 | 51 | 0.1 |
| 24 | 53 | 0.2 |
| 25 | 55 | 0.6 |
| 26 | 57 | 1.0 |
| 27 | 60 | 1.7 |
| 28 | 62 | 2.7 |
| 29 | 64 | 3.5 |
| 30 | 66 | 4.8 |
| 31 | 68 | 5.5 |
| 32 | 71 | 5.8 |
| 33 | 73 | 5.9 |
| 34 | 75 | 5.9 |
| 35 | 77 | 6.3 |
| 36 | 79 | 5.5 |
| 37 | 82 | 5.4 |
| 38 | 84 | 4.8 |
| 39 | 86 | 5.0 |
| 40 | 88 | 4.0 |
| 41 | 90 | 3.9 |
| 42 | 93 | 3.4 |
| 43 | 95 | 2.9 |
| 44 | 97 | 2.6 |
| 45 | 99 | 2.3 |
| 46 | 101 | 1.7 |
| 47 | 104 | 1.9 |
| 48 | 106 | 1.6 |
| 49 | 108 | 1.5 |
| 50 | 110 | 1.2 |
| 51 | 112 | 1.1 |
| 52 | 115 | 0.9 |
| 53 | 117 | 0.9 |
| 54 | 119 | 0.7 |
| 55 | 121 | 0.6 |
| 56 | 123 | 0.5 |
| 57 | 126 | 0.5 |
| 58 | 128 | 0.4 |
| 59 | 130 | 0.3 |
| 60 | 132 | 0.3 |
| 61 | 134 | 0.3 |
| 62 | 137 | 0.3 |
| 63 | 139 | 0.2 |
| 64 | 141 | 0.1 |
| 65 | 143 | 0.2 |
| 66 | 146 | 0.2 |
| 67 | 148 | 0.1 |
| 68 | 150 | 0.1 |
| 69 | 152 | 0.1 |
| 70 | 154 | 0.1 |
| 71 | 157 | 0.1 |
| 72 | 159 | 0.1 |
| 73 | 161 | 0.1 |
| 74 | 163 | 0.0 |
| 75 | 165 | 0.1 |
| 76 | 168 | 0.0 |
| 77 | 170 | 0.0 |
| 78 | 172 | 0.0 |
| 79 | 174 | 0.0 |
| 80 | 176 | 0.0 |
| 81 | 179 | 0.0 |
| 82 | 181 | 0 |
| 83 | 183 | 0.0 |
| 84 | 185 | 0.0 |
| 85 | 187 | 0 |
| 86 | 190 | 0.0 |
| 87 | 192 | 0.0 |
| 88 | 194 | 0 |
| 89 | 196 | 0.0 |
| 90 | 198 | 0 |
| 91 | 201 | 0 |
| 92 | 203 | 0 |
| 93 | 205 | 0.0 |
| 94 | 207 | 0 |
| 95 | 209 | 0 |
| 96 | 212 | 0 |
| 97 | 214 | 0 |
| 98 | 216 | 0 |
| 99 | 218 | 0 |
| 100 | 220 | 0.0 |
| 101 | 223 | 0 |
| 102 | 225 | 0 |
Source is Ministry of Education, Culture, Sports, Science and Technology.
www.mext.go.jp/b_menu/toukei/chousa05/hoken/kekka/k_detail/1365985.htm
www.e-stat.go.jp/SG1/estat/Xlsdl.do?sinfid=000031399258
Related Topics
Other Related Topics