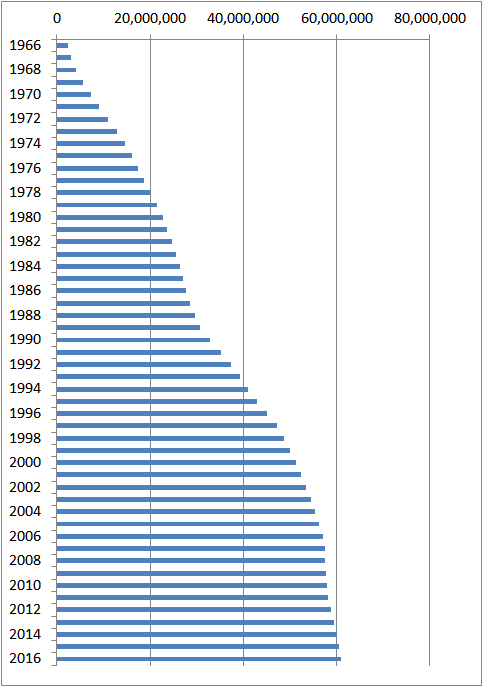
Changes in the Number of Cars in Japan, 1966-2016
The following data shows the changes in the number of cars (exclude trucks and buses) in Japan between 1966 and 2016.
The number of cars is still increasing.
Figure: Changes in the Number of Cars in Japan, 1966-2016

| Year | Cars (exclude trucks and buses) |
| 1966 | 2,289,665 |
| 1967 | 2,996,254 |
| 1968 | 4,091,752 |
| 1969 | 5,514,190 |
| 1970 | 7,270,573 |
| 1971 | 9,104,593 |
| 1972 | 10,915,284 |
| 1973 | 12,964,298 |
| 1974 | 14,551,868 |
| 1975 | 16,044,338 |
| 1976 | 17,377,551 |
| 1977 | 18,618,213 |
| 1978 | 19,942,495 |
| 1979 | 21,409,307 |
| 1980 | 22,751,052 |
| 1981 | 23,646,119 |
| 1982 | 24,578,524 |
| 1983 | 25,435,492 |
| 1984 | 26,320,361 |
| 1985 | 27,038,220 |
| 1986 | 27,790,194 |
| 1987 | 28,538,497 |
| 1988 | 29,601,092 |
| 1989 | 30,712,558 |
| 1990 | 32,937,813 |
| 1991 | 35,151,831 |
| 1992 | 37,310,632 |
| 1993 | 39,164,550 |
| 1994 | 41,060,611 |
| 1995 | 42,956,339 |
| 1996 | 45,068,530 |
| 1997 | 47,214,826 |
| 1998 | 48,684,206 |
| 1999 | 49,968,149 |
| 2000 | 51,222,129 |
| 2001 | 52,449,354 |
| 2002 | 53,487,293 |
| 2003 | 54,471,376 |
| 2004 | 55,288,124 |
| 2005 | 56,288,256 |
| 2006 | 57,097,670 |
| 2007 | 57,510,360 |
| 2008 | 57,551,248 |
| 2009 | 57,682,475 |
| 2010 | 57,902,835 |
| 2011 | 58,139,471 |
| 2012 | 58,729,343 |
| 2013 | 59,357,223 |
| 2014 | 60,051,338 |
| 2015 | 60,517,249 |
| 2016 | 60,831,892 |
Source is Automobile Inspection & Registration Information Association.
www.airia.or.jp/publish/statistics/ao1lkc00000000z4-att/01_hoyu_suii.pdf
Related Topics