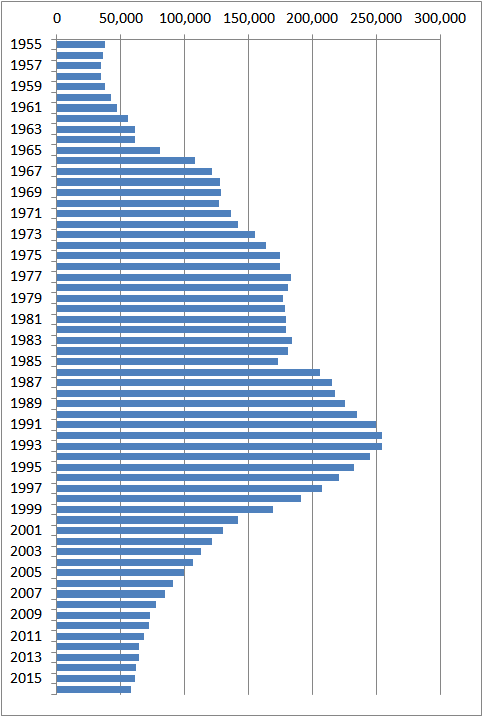
The following data shows the changes in the number of 2 year-college student enrollments in Japan between 1955 and 2016.
Figure: The Changes in the Number of 2 Year-College Student Enrollments in Japan, 1955-2016

| Year | 2 Year-College student enrollment |
| 1955 | 37,544 |
| 1956 | 36,285 |
| 1957 | 34,133 |
| 1958 | 34,888 |
| 1959 | 37,889 |
| 1960 | 42,318 |
| 1961 | 47,278 |
| 1962 | 55,613 |
| 1963 | 61,417 |
| 1964 | 61,070 |
| 1965 | 80,563 |
| 1966 | 108,052 |
| 1967 | 121,263 |
| 1968 | 127,365 |
| 1969 | 128,124 |
| 1970 | 126,659 |
| 1971 | 136,392 |
| 1972 | 141,631 |
| 1973 | 154,771 |
| 1974 | 164,077 |
| 1975 | 174,930 |
| 1976 | 174,683 |
| 1977 | 183,224 |
| 1978 | 181,181 |
| 1979 | 176,979 |
| 1980 | 178,215 |
| 1981 | 179,071 |
| 1982 | 179,601 |
| 1983 | 183,871 |
| 1984 | 181,223 |
| 1985 | 173,503 |
| 1986 | 206,083 |
| 1987 | 215,088 |
| 1988 | 218,036 |
| 1989 | 225,364 |
| 1990 | 235,195 |
| 1991 | 249,552 |
| 1992 | 254,676 |
| 1993 | 254,953 |
| 1994 | 244,895 |
| 1995 | 232,741 |
| 1996 | 220,875 |
| 1997 | 207,546 |
| 1998 | 191,430 |
| 1999 | 168,973 |
| 2000 | 141,491 |
| 2001 | 130,246 |
| 2002 | 121,441 |
| 2003 | 113,029 |
| 2004 | 106,204 |
| 2005 | 99,431 |
| 2006 | 90,740 |
| 2007 | 84,596 |
| 2008 | 77,339 |
| 2009 | 73,163 |
| 2010 | 72,047 |
| 2011 | 68,432 |
| 2012 | 64,063 |
| 2013 | 64,653 |
| 2014 | 61,699 |
| 2015 | 60,998 |
| 2016 | 58,225 |
Source is Ministry of Education, Culture, Sports, Science and Technology.
学校基本調査 年次統計
www.e-stat.go.jp/SG1/estat/List.do?bid=000001015843&cycode=0
www.e-stat.go.jp/SG1/estat/Xlsdl.do?sinfid=000018434812
Related Topics