Number of Lawyers in Japan by Prefecture, 2018
There are 40,066 lawyers in Japan as of 2018 March 31. The following data show the number of registered lawyers by prefecture.
Table: Number of Lawyers in Japan by Prefecture, 2018
| Prefecture | Lawyers | Population per a lawyer | Lawyer per 10,000 residents |
| Tokyo | 18,879 | 727 | 13.76 |
| Osaka | 4,562 | 1,934 | 5.17 |
| Aichi | 1,958 | 3,843 | 2.60 |
| Kanagawa | 1,635 | 5,602 | 1.79 |
| Fukuoka | 1,281 | 3,987 | 2.51 |
| Hokkaido | 1,004 | 5,299 | 1.89 |
| Hyōgo | 934 | 5,892 | 1.70 |
| Saitama | 870 | 8,402 | 1.19 |
| Chiba | 798 | 7,827 | 1.28 |
| Kyoto | 768 | 3,384 | 2.95 |
| Hiroshima | 579 | 4,886 | 2.05 |
| Shizuoka | 478 | 7,688 | 1.30 |
| Miyagi | 453 | 5,128 | 1.95 |
| Okayama | 401 | 4,756 | 2.10 |
| Gunma | 289 | 6,782 | 1.47 |
| Ibaraki | 286 | 10,112 | 0.99 |
| Niigata | 280 | 8,096 | 1.24 |
| Kumamoto | 279 | 6,326 | 1.58 |
| Okinawa | 267 | 5,404 | 1.85 |
| Nagano | 242 | 8,579 | 1.17 |
| Tochigi | 222 | 8,815 | 1.13 |
| Kagoshima | 211 | 7,706 | 1.30 |
| Gifu | 204 | 9,843 | 1.02 |
| Fukushima | 203 | 9,271 | 1.08 |
| Mie | 185 | 9,730 | 1.03 |
| Yamaguchi | 177 | 7,814 | 1.28 |
| Ishikawa | 173 | 6,630 | 1.51 |
| Kagawa | 173 | 5,590 | 1.79 |
| Nara | 170 | 7,929 | 1.26 |
| Ehime | 164 | 8,317 | 1.20 |
| Oita | 161 | 7,155 | 1.40 |
| Nagasaki | 160 | 8,463 | 1.18 |
| Shiga | 153 | 9,235 | 1.08 |
| Wakayama | 146 | 6,473 | 1.54 |
| Miyazaki | 139 | 7,835 | 1.28 |
| Toyama | 125 | 8,448 | 1.18 |
| Yamanashi | 123 | 6,691 | 1.49 |
| Aomori | 113 | 11,310 | 0.88 |
| Fukui | 107 | 7,280 | 1.37 |
| Saga | 106 | 7,774 | 1.29 |
| Iwate | 104 | 12,067 | 0.83 |
| Yamagata | 98 | 11,245 | 0.89 |
| Tokushima | 94 | 7,904 | 1.27 |
| Kochi | 87 | 8,207 | 1.22 |
| Shimane | 82 | 8,354 | 1.20 |
| Akita | 78 | 12,769 | 0.78 |
| Tottori | 65 | 8,692 | 1.15 |
| Total | 40,066 | 3,162 |

Source is Japan Federation of Bar Associations. 弁護士1人あたりの人口比較
www.nichibenren.or.jp/jfba_info/statistics/reform/fundamental_statistics.html
Related Topics
Station Passenger Numbers in Tokyo, 2016
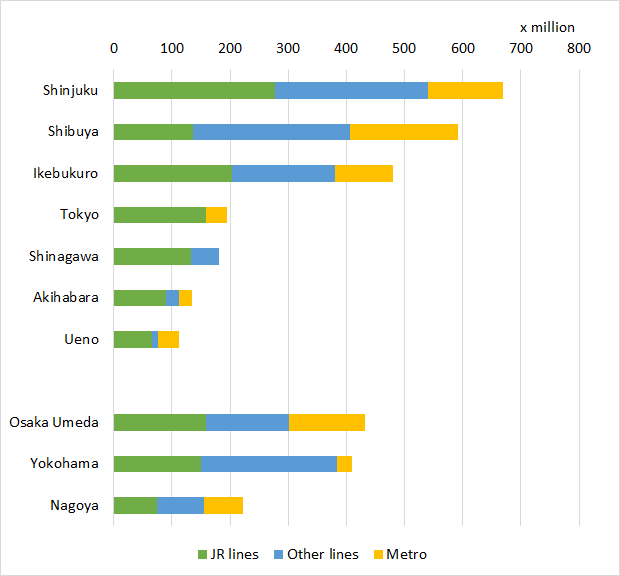
The following data show the number of passengers who used major stations in Tokyo a year, in 2016. It is the number of passengers who got on trains. It does not include passengers who got off trains. In Japan, those two types of passengers were counted separately. 654 million people used Shinjuku station in 2016 (per year).
Table: Station Passenger Numbers in Tokyo, 2016 (unit: x 1000 passengers/year)
| JR lines | Other lines | Metro | Total | in 2013 | |
| Shinjuku | 278,176 | 262,178 | 128,998 | 669,352 | 654,902 |
| Shibuya | 136,238 | 270,875 | 184,579 | 591,692 | 573,534 |
| Ikebukuro | 203,782 | 177,128 | 98,697 | 479,607 | 471,423 |
| Tokyo | 159,076 | 35,125 | 194,201 | 183,880 | |
| Shinagawa | 132,297 | 49,464 | 181,761 | 170,047 | |
| Akihabara | 89,275 | 22,576 | 21,972 | 133,823 | 132,345 |
| Ueno | 66,461 | 9,027 | 37,096 | 112,584 | 113,012 |
| Osaka Umeda | 158,018 | 142,802 | 131,928 | 432,748 | 421,301 |
| Yokohama | 150,566 | 234,160 | 24,709 | 409,435 | 405,021 |
| Nagoya | 74,850 | 79,877 | 67,547 | 222,274 | 217,538 |
Osaka, Yokohama, and Nagoya are reference data.
JR: Former Japan National Railway
Metro: Subway, underground
Others: Companies except JR and metro
Figure: Station Passenger Numbers in Tokyo, 2016 (per year)

Source is Source is a booklet "Kurashi to Tokei 2018" くらしと統計 2018.
www.toukei.metro.tokyo.jp/kurasi/2018/ku18-18.htm
Related Topics
College-Going Rate in Tokyo, in 2018
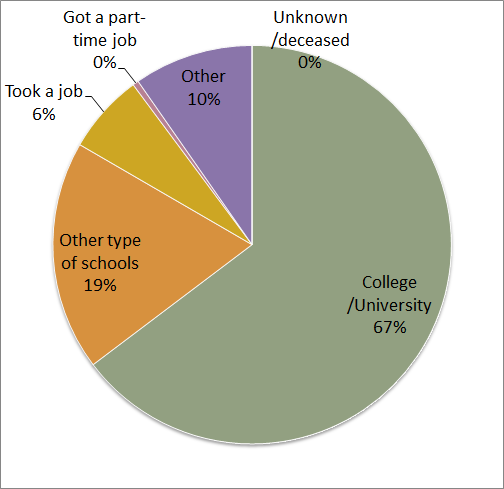
101,782 students graduated from senior high schools in Tokyo in 2018. 64.7% of them entered colleges/universities. 19,000 persons were enrolled in other type of schools, such as a vocational school. 7,000 took jobs. 9,900 had not determined their destinations (some are studying to go university next year, others are searching jobs). Here are the statistics.
It does not include persons;
- who did not go to senior high school
- who dropped out of high school
Some people in "other" category will enter colleges next year. So the stats are rough indication.
Figure: College-Going Rate and Employment Rate of Graduates in Tokyo, 2018

Table: College-Going Rate and Employment Rate of Graduates in Tokyo, 2018
| Next career | Number |
| College/University | 65,863 |
| Other type of schools | 18,993 |
| Took a job | 6,567 |
| Got a part-time job | 489 |
| Other | 9,860 |
| Unknown/deceased | 10 |
Source is Tokyo Metropolitan Government. 平成30年度 学校基本統計(学校基本調査報告書)
www.toukei.metro.tokyo.jp/gakkou/2018/gk18qg10000.htm#kousotu
区市町村、状況別卒業者数、大学等進学率及び卒業者に占める就職者の割合(総数)
www.toukei.metro.tokyo.jp/gakkou/2018/gk18qa1511.xls
Related Topics