Number of Prisoners in Japan by Age, 2015
The following data show the ratio of prisoners by age, in 2015 December.
40s are the biggest cluster.
Figure 1: Percentage of Male Prisoners in Japan by Age, 2015

Figure 2: Percentage of Female Prisoners in Japan by Age, 2015

Table: Number of Prisoners in Japan by Age, 2015
| Age | Men | Women |
| under 30 | 5995 | 397 |
| 30-39 | 10817 | 913 |
| 40-49 | 12975 | 1293 |
| 50-59 | 8564 | 755 |
| 60-69 | 5999 | 492 |
| 70 and over | 2568 | 407 |
Source is Ministry of Justice.
www.e-stat.go.jp/SG1/estat/List.do?lid=000001155287
Related Topics
Changes in the Gender Ratio in Japan, 1920-2015
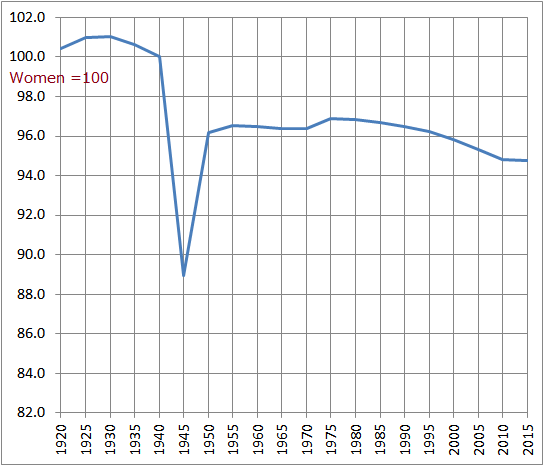
The following data show the changes in the gender ratio (if population of women = 100) in Japan, between 1920 and 2015.
Many men died in World War II, then the men's population was low in 1945.
Figure: Changes in Gender Ratio in Japan, 1920-2015

| Year | Gender ratio (women=100) |
| 1920 | 100.4 |
| 1925 | 101.0 |
| 1930 | 101.0 |
| 1935 | 100.6 |
| 1940 | 100.0 |
| 1945 | 89.0 |
| 1950 | 96.2 |
| 1955 | 96.5 |
| 1960 | 96.5 |
| 1965 | 96.4 |
| 1970 | 96.4 |
| 1975 | 96.9 |
| 1980 | 96.9 |
| 1985 | 96.7 |
| 1990 | 96.5 |
| 1995 | 96.2 |
| 2000 | 95.8 |
| 2005 | 95.3 |
| 2010 | 94.8 |
| 2015 | 94.8 |
Source is Statistics Bureau.
www.e-stat.go.jp/SG1/estat/GL08020101.do?_toGL08020101_&tstatCode=000001011777&requestSender=search
www.e-stat.go.jp/SG1/estat/GL08020103.do?_xlsDownload_&fileId=000007822259&releaseCount=3
Related Topics
Motor Vehicle Deaths in Japan, 2016
National Police Agency reported that 3,904 of people were killed by car accidents in 2016. Those were the victims only who died within 24 hours after the accidents. The actual victims are more than them.
The number of victims decreased by 213 from 2015.
The following figure shows the rate of motor vehicle deaths by prefecture in 2016.
Red prefectures are high risk regions. Blue prefectures are relatively low risk areas. Tokyo is the lowest.
Figure: Motor Vehicle Death Rate per 100,000 by Prefecture in 2016

Table: Motor Vehicle Deaths by Prefecture in 2016
| Prefecture | Deaths |
| Aichi | 212 |
| Chiba | 185 |
| Osaka | 161 |
| Tokyo | 159 |
| Hokkaido | 158 |
| Hyōgo | 152 |
| Saitama | 151 |
| Ibaraki | 150 |
| Fukuoka | 143 |
| Kanagawa | 140 |
| Shizuoka | 137 |
| Nagano | 121 |
| Niigata | 107 |
| Mie | 100 |
| Fukushima | 90 |
| Gifu | 90 |
| Hiroshima | 86 |
| Okayama | 79 |
| Ehime | 77 |
| Tochigi | 76 |
| Iwate | 73 |
| Miyagi | 71 |
| Kumamoto | 67 |
| Kagoshima | 65 |
| Yamaguchi | 64 |
| Gunma | 62 |
| Kagawa | 61 |
| Toyama | 60 |
| Kyoto | 60 |
| Akita | 54 |
| Aomori | 53 |
| Shiga | 53 |
| Fukui | 51 |
| Tokushima | 49 |
| Ishikawa | 48 |
| Nara | 47 |
| Miyazaki | 45 |
| Kochi | 42 |
| Oita | 42 |
| Nagasaki | 41 |
| Wakayama | 40 |
| Okinawa | 39 |
| Yamanashi | 35 |
| Saga | 35 |
| Yamagata | 28 |
| Shimane | 28 |
| Tottori | 17 |
Table: Motor Vehicle Death Rate per 100,000 by Prefecture in 2016
| Prefecture | Rate per 100,000 |
| Tokushima | 6.48 |
| Fukui | 6.48 |
| Kagawa | 6.25 |
| Kochi | 5.77 |
| Nagano | 5.77 |
| Iwate | 5.70 |
| Toyama | 5.63 |
| Ehime | 5.56 |
| Mie | 5.51 |
| Akita | 5.28 |
| Ibaraki | 5.14 |
| Fukushima | 4.70 |
| Niigata | 4.64 |
| Yamaguchi | 4.56 |
| Gifu | 4.43 |
| Saga | 4.20 |
| Yamanashi | 4.19 |
| Ishikawa | 4.16 |
| Wakayama | 4.15 |
| Okayama | 4.11 |
| Miyazaki | 4.08 |
| Aomori | 4.05 |
| Shimane | 4.03 |
| Kagoshima | 3.94 |
| Tochigi | 3.85 |
| Shiga | 3.75 |
| Kumamoto | 3.75 |
| Shizuoka | 3.70 |
| Oita | 3.60 |
| Nara | 3.44 |
| Gunma | 3.14 |
| Miyagi | 3.04 |
| Hiroshima | 3.02 |
| Nagasaki | 2.98 |
| Chiba | 2.97 |
| Tottori | 2.96 |
| Hokkaido | 2.94 |
| Aichi | 2.83 |
| Fukuoka | 2.80 |
| Hyōgo | 2.75 |
| Okinawa | 2.72 |
| Yamagata | 2.49 |
| Kyoto | 2.30 |
| Saitama | 2.08 |
| Osaka | 1.82 |
| Kanagawa | 1.53 |
| Tokyo | 1.18 |
Source is National Police Agency.
www.npa.go.jp/toukei/index.htm#koutsuu
www.e-stat.go.jp/SG1/estat/List.do?lid=000001168544
Related Topics