Distribution of Yearly Household Incomes in Japan, 2016
Ministry of Health, Labour and Welfare issued the result of National Livelihood Survey 2016. According to it, the average yearly income of Japanese household was 5,602,000 yen ($49,639 €43,460) in 2016. In 2012, the average household income was 5,372,000 yen.
The median income was 4,420,000 yen ($39,165 €34,290). 61.5% of people live by the below average income.
In the survey, "income" includes taxes and social security charges. So the after-tax pay (take-home money) is less than "income".
The below shows the percentage distribution of yearly household incomes.
Table: Distribution of Yearly Household Income in Japan, 2016
| Household income (million yen) | % |
| < 0.5 | 1.0 |
| 0.5 – 1.0 | 4.6 |
| 1.0 – 1.5 | 5.9 |
| 1.5 – 2.0 | 6.4 |
| 2.0 – 2.5 | 6.9 |
| 2.5 – 3.0 | 6.5 |
| 3.0 – 3.5 | 7.3 |
| 3.5 – 4.0 | 6.5 |
| 4.0 – 4.5 | 5.6 |
| 4.5 – 5.0 | 5.0 |
| 5.0 – 5.5 | 4.7 |
| 5.5 – 6.0 | 4.2 |
| 6.0 – 6.5 | 4.3 |
| 6.5 – 7.0 | 3.2 |
| 7.0 – 7.5 | 3.3 |
| 7.5 – 8.0 | 2.9 |
| 8.0 – 8.5 | 2.9 |
| 8.5 – 9.0 | 2.7 |
| 9.0 – 9.5 | 1.9 |
| 9.5 – 10.0 | 1.7 |
| 10.0 – 11.0 | 3.0 |
| 11.0 – 12.0 | 2.2 |
| 12.0 – 15.0 | 4.1 |
| 15.0 – 20.0 | 2.0 |
| 20.0 < | 1.3 |

Source is Ministry of Health, Labour and Welfare. 平成29年国民生活基礎調査
www.e-stat.go.jp/stat-search/files?page=1&layout=datalist&toukei=00450061&tstat=000001114903&cycle=7&tclass1=000001117095&tclass2=000001117096&second=1&second2=1
www.e-stat.go.jp/stat-search/file-download?statInfId=000031736396&fileKind=1
Related Topics
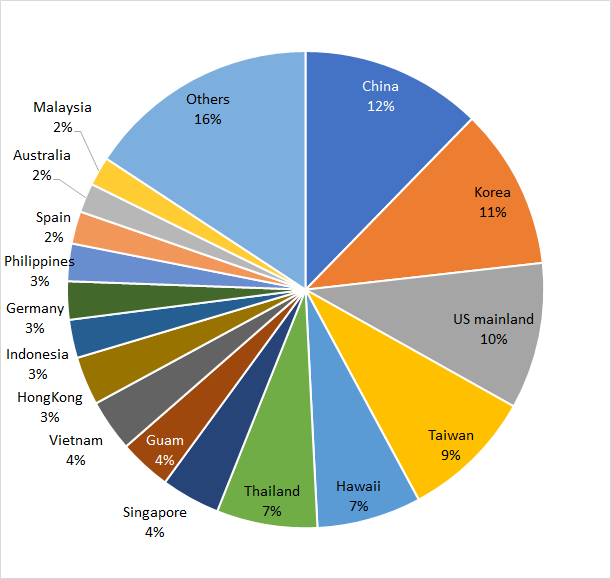
Number of Outbound Tourists from Japan by Destination in 2017
Japan National Tourism Organization reported the number of outbound tourists in 2017. According to Ministry of Justice, 17,889,292 people went overseas from Japan in 2017. The following data show the detail by destination.
Table: Number of outbound tourists from Japan by destination (country/region), 2017
| To | Number of tourists |
| China | 2,587,440 |
| Korea | 2,297,893 |
| US mainland | 2,088,976 |
| Taiwan | 1,895,702 |
| Hawaii | 1,487,979 |
| Thailand | 1,439,510 |
| Singapore | 840,231 |
| Guam | 745,680 |
| Vietnam | 740,592 |
| Hong Kong | 692,529 |
| Indonesia | 545,392 |
| Germany | 545,013 |
| Philippines | 535,238 |
| Spain | 463,420 |
| Australia | 417,880 |
| Malaysia | 413,768 |
| France | 411,043 |
| Italy | 403,879 |
| Canada | 303,726 |
| Macao | 300,536 |
| UK | 245,823 |
| India | 208,847 |
| Austria | 208,710 |
| Switzerland | 197,567 |
| Cambodia | 191,577 |
| Mexico | 132,976 |
| Croatia | 120,971 |
| Finland | 114,463 |
| Portugal | 106,830 |
| Netherlands | 106,000 |
| Czech | 105,771 |
| Myanmar | 100,784 |
| New Zealand | 100,736 |
| Poland | 88,000 |
| Russia | 84,631 |
| Brazil | 79,754 |
| Norway | 78,046 |
| Northern MarianaIslands | 61,026 |

Source is JNTO
www.jnto.go.jp/jpn/statistics/visitor_trends/index.html
www.jnto.go.jp/jpn/statistics/20181026_6.pdf
Related Topics
Number of Inbound Tourists to Japan by Country/region in 2017
Japan National Tourism Organization reported the number of inbound tourists in 2017. According to it, 28,691,073 visitors came to Japan in 2017. The following data show the detail by country/region.
Table: Number of inbound tourists to Japan by country/region, 2017
| From | Number of Tourists |
| China | 7,355,818 |
| South Korea | 7,140,438 |
| Taiwan | 4,564,053 |
| Hong Kong | 2,231,568 |
| USA | 1,374,964 |
| Thailand | 987,211 |
| Australia | 495,054 |
| Malaysia | 439,548 |
| Philippines | 424,121 |
| Singapore | 404,132 |
| Indonesia | 352,330 |
| UK | 310,499 |
| Vietnam | 308,898 |
| Canada | 305,591 |
| France | 268,605 |
| Germany | 195,606 |
| India | 134,371 |
| Italy | 125,864 |
| Macau | 115,304 |
| Spain | 99,814 |
| Russia | 77,251 |
| Others | 980,033 |

Source is JNTO
www.jnto.go.jp/jpn/statistics/visitor_trends/index.html
www.jnto.go.jp/jpn/statistics/since2003_tourists.xlsx
Related Topics