Tokyo Olympic, Game Venue Area is Off Limits to Locals, Like a Military Base
Last Sunday (August 1st) I walked to Oi Pier Central Seaside Park. At that time, the men's hockey quarterfinals were played at Oi Hockey Stadium in the park.
Sadly, I have not seen anything about hockey games there. Spectators cannot enter the stadium at this Olympic Games. And we are not allowed to enter the area around the stadium, also.
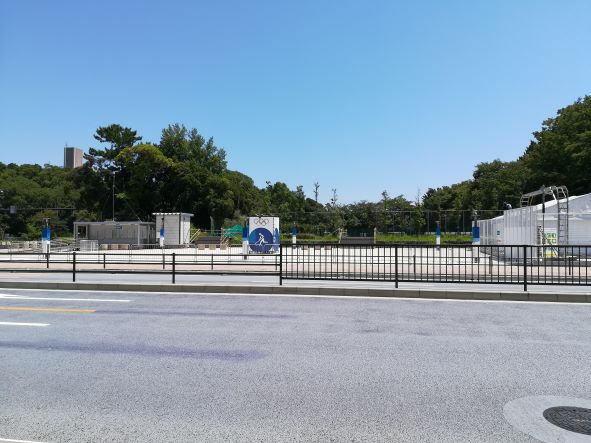
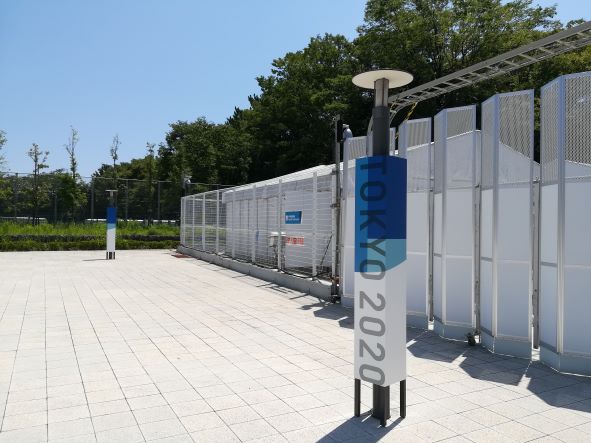
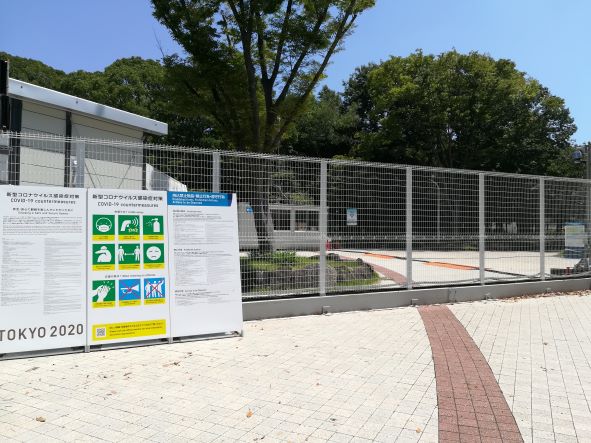
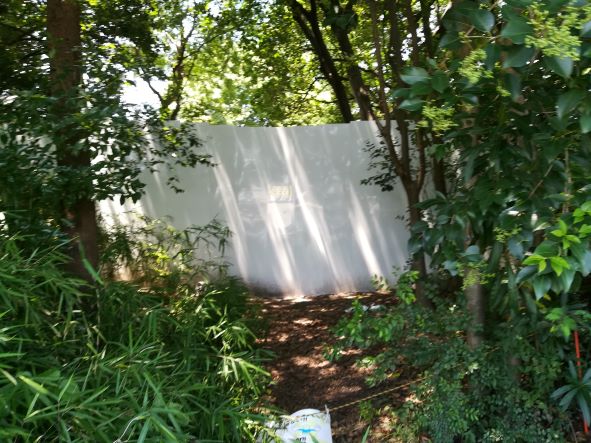
Every entrance to access the stadium were blocked by walls.
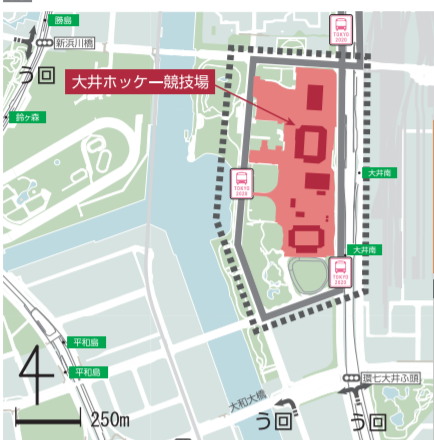
It is not allowed to enter the red zone in the above. The red square with the arrow is the main stadium.

Many policemen guard the park to keep visitors out. Those policemen are sent from Shiga prefecture police and Kagoshima prefecture police (both are far from Tokyo).
It looked like a military base, or a maximum security lab.
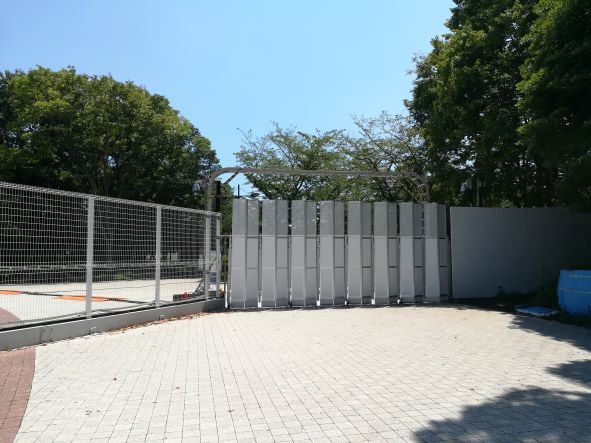
I took some photos at the following points.

Below is Point A, supposed to be the entrance for spectators
It was the day of men's quarterfinals.
Point B:
Point C:

Point D:

Point E: That is not the main stadium, but a track

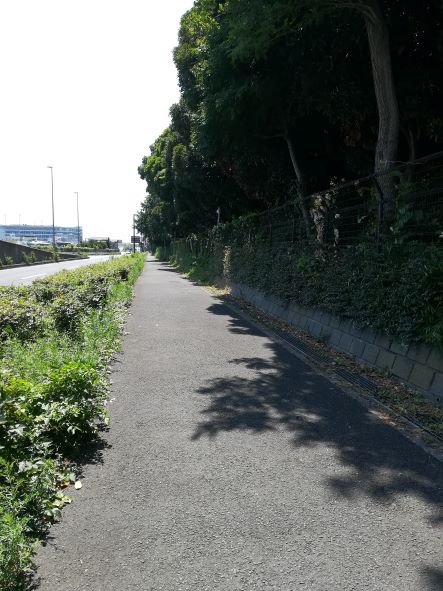
Point F: Side road, very quiet
It was the most boring Olympic Games ever for the local people.
Please spread it to the world.
Number of Senior High Schools in Japan, 1955-2020
There are 4874 senior high schools in Japan in 2020, according to the statistics of the Ministry of Education, Culture, Sports, Science and Technology.
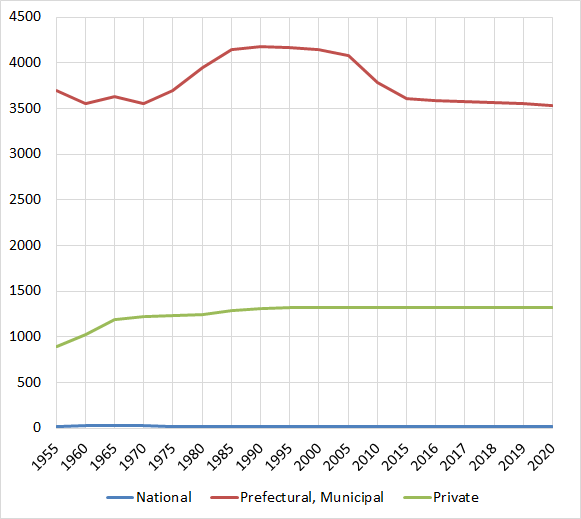
The following shows the evolution of the number of senior high schools between 1955 and 2020.
Table 1: Number of senior high schools, 1955-2020.
| Total | National | Prefectural, Municipal | Private | Percentage of private school (%) | |
| 1955 | 4,607 | 21 | 3,691 | 895 | 19.4 |
| 1960 | 4,598 | 23 | 3,554 | 1,021 | 22.2 |
| 1965 | 4,849 | 24 | 3,633 | 1,192 | 24.6 |
| 1970 | 4,798 | 24 | 3,550 | 1,224 | 25.5 |
| 1975 | 4,946 | 17 | 3,701 | 1,228 | 24.8 |
| 1980 | 5,208 | 17 | 3,951 | 1,240 | 23.8 |
| 1985 | 5,453 | 17 | 4,147 | 1,289 | 23.6 |
| 1990 | 5,506 | 17 | 4,177 | 1,312 | 23.8 |
| 1995 | 5,501 | 17 | 4,164 | 1,320 | 24.0 |
| 2000 | 5,478 | 15 | 4,145 | 1,318 | 24.1 |
| 2005 | 5,418 | 15 | 4,082 | 1,321 | 24.4 |
| 2010 | 5,116 | 15 | 3,780 | 1,321 | 25.8 |
| 2015 | 4,939 | 15 | 3,604 | 1,320 | 26.7 |
| 2016 | 4,925 | 15 | 3,589 | 1,321 | 26.8 |
| 2017 | 4,907 | 15 | 3,571 | 1,321 | 26.9 |
| 2018 | 4,897 | 15 | 3,559 | 1,323 | 27.0 |
| 2019 | 4,887 | 15 | 3,550 | 1,322 | 27.1 |
| 2020 | 4,874 | 15 | 3,537 | 1,322 | 27.1 |
Figure: Number of senior high schools, 1955-2020.
In addition to general senior high schools, there are colleges of technology and secondary schools in Japan for students aged 15 to 18 to attend.
College of technology is a five-year course that is mainly attended by students aged 15 to 20 after graduating from junior high school.
Secondary school is a combination of junior high school and senior high school, and is attended by students aged 12 to 18.
The next data shows the changes in the number of colleges of technology and secondary schools in Japan between 1962 and 2020.
Table 2: Number of colleges of technology, 1955-2020.
| Total | National | Prefectural, Municipal | Private | |
| 1962 | 19 | 12 | 2 | 5 |
| 1965 | 54 | 43 | 4 | 7 |
| 1970 | 60 | 49 | 4 | 7 |
| 1975 | 65 | 54 | 4 | 7 |
| 1980 | 62 | 54 | 4 | 4 |
| 1985 | 62 | 54 | 4 | 4 |
| 1990 | 62 | 54 | 4 | 4 |
| 1995 | 62 | 54 | 5 | 3 |
| 2000 | 63 | 54 | 5 | 3 |
| 2005 | 63 | 55 | 5 | 3 |
| 2010 | 58 | 51 | 4 | 3 |
| 2015 | 57 | 51 | 3 | 3 |
| 2016 | 57 | 51 | 3 | 3 |
| 2017 | 57 | 51 | 3 | 3 |
| 2018 | 57 | 51 | 3 | 3 |
| 2019 | 57 | 51 | 3 | 3 |
| 2020 | 57 | 51 | 3 | 3 |
Table 3: Number of secondary schools, 1955-2020.
| Total | National | Prefectural, Municipal | Private | Percentage of private school (%) | |
| 1999 | 1 | - | 1 | - | - |
| 2000 | 4 | 2 | 1 | 1 | 25.0 |
| 2005 | 19 | 2 | 8 | 9 | 47.4 |
| 2010 | 48 | 4 | 28 | 16 | 33.3 |
| 2015 | 52 | 4 | 31 | 17 | 32.7 |
| 2016 | 52 | 4 | 31 | 17 | 32.7 |
| 2017 | 53 | 4 | 31 | 18 | 34.0 |
| 2018 | 53 | 4 | 31 | 18 | 34.0 |
| 2019 | 54 | 4 | 32 | 18 | 33.3 |
| 2020 | 56 | 4 | 33 | 19 | 33.9 |
Source is Ministry of Education, Culture, Sports, Science and Technology. 文部科学統計要覧(令和3年版)
www.mext.go.jp/b_menu/toukei/002/002b/1417059_00006.htm
Related Topics
Number of College/University Students by Major in Japan, 1960-2020
The following data show the change in the number of students at colleges/universities by their major in Japan from 1960 to 2020.
The number of medical field students (mainly nursing study) is increasing recently. The number of students in interdisciplinary fields (called "others" in the following table) is also increasing. Surprisingly, the number of agricultural students is increasing. Despite the fact that the number of Japanese farmers is declining.
Table: Change in the number of students at colleges/universities by major in Japan from 1960 to 2020
| 1960 | 1980 | 2000 | 2020 | |
| Humanities | 77,888 | 239,990 | 410,979 | 364,474 |
| Social science | 257,979 | 704,737 | 985,617 | 835,595 |
| Science | 16,206 | 54,579 | 87,901 | 78,353 |
| Engineering | 92,572 | 337,767 | 467,162 | 382,341 |
| Agriculture | 28,040 | 59,558 | 70,308 | 77,622 |
| Medicine & Dentistry | 23,026 | 71,413 | 64,309 | 72,245 |
| Health (exclude MD/Dentist) | 12,607 | 40,645 | 79,328 | 266,803 |
| Mercantile marine | 1,429 | 1,595 | 905 | 411 |
| Home economics | 8,203 | 31,930 | 44,298 | 72,117 |
| Education & teacher training | 63,169 | 133,211 | 137,615 | 189,986 |
| Arts | 9,325 | 44,158 | 65,208 | 74,755 |
| Others | 11,020 | 21,921 | 58,125 | 208,870 |
Figure 1: Change in the number of students at colleges/universities by major in Japan from 1960 to 2020 (Faculties with a large number of students)

Figure 2: Change in the number of students at colleges/universities by major in Japan from 1960 to 2020 (Faculties with a small number of students)

Source is Ministry of Education, Culture, Sports, Science and Technology. 文部科学統計要覧(令和3年版)
www.mext.go.jp/b_menu/toukei/002/002b/1417059_00006.htm
Related Topics