Number of College/University Students in Japan, 1955-2020
Japan had 2,915,605 students at colleges and universities in 2020, according to the statistics of the Ministry of Education, Culture, Sports, Science and Technology.
The following shows the changes in the number of college/university students between 1955 and 2020.
Table: Number of College/University Students, 1955-2020
| Total | in which, female students | National Schools | Prefectural, Municipal Schools | Private Schools | Percentage of Female | Percentage of Private | |
| 1955 | 523,355 | 65,081 | 186,055 | 24,936 | 312,364 | 12.4 | 59.7 |
| 1960 | 626,421 | 85,966 | 194,227 | 28,569 | 403,625 | 13.7 | 64.4 |
| 1965 | 937,556 | 152,119 | 238,380 | 38,277 | 660,899 | 16.2 | 70.5 |
| 1970 | 1,406,521 | 252,745 | 309,587 | 50,111 | 1,046,823 | 18.0 | 74.4 |
| 1975 | 1,734,082 | 368,258 | 357,772 | 50,880 | 1,325,430 | 21.2 | 76.4 |
| 1980 | 1,835,312 | 405,529 | 406,644 | 52,082 | 1,376,586 | 22.1 | 75.0 |
| 1985 | 1,848,698 | 434,401 | 449,373 | 54,944 | 1,344,381 | 23.5 | 72.7 |
| 1990 | 2,133,362 | 584,155 | 518,609 | 64,140 | 1,550,613 | 27.4 | 72.7 |
| 1995 | 2,546,649 | 821,893 | 598,723 | 83,812 | 1,864,114 | 32.3 | 73.2 |
| 2000 | 2,740,023 | 992,312 | 624,082 | 107,198 | 2,008,743 | 36.2 | 73.3 |
| 2005 | 2,865,051 | 1,124,900 | 627,850 | 124,910 | 2,112,291 | 39.3 | 73.7 |
| 2010 | 2,887,414 | 1,185,580 | 625,048 | 142,523 | 2,119,843 | 41.1 | 73.4 |
| 2015 | 2,860,210 | 1,231,868 | 610,802 | 148,766 | 2,100,642 | 43.1 | 73.4 |
| 2016 | 2,873,624 | 1,247,726 | 610,401 | 150,513 | 2,112,710 | 43.4 | 73.5 |
| 2017 | 2,890,880 | 1,263,893 | 609,473 | 152,931 | 2,128,476 | 43.7 | 73.6 |
| 2018 | 2,909,159 | 1,280,406 | 608,969 | 155,520 | 2,144,670 | 44.0 | 73.7 |
| 2019 | 2,918,668 | 1,293,095 | 606,449 | 158,176 | 2,154,043 | 44.3 | 73.8 |
| 2020 | 2,915,605 | 1,294,320 | 598,881 | 158,579 | 2,158,145 | 44.4 | 74.0 |

Source is Ministry of Education, Culture, Sports, Science and Technology.
www.mext.go.jp/b_menu/toukei/002/002b/1417059_00006.htm
Related Topics
Number of Colleges and Universities in Japan, 1955-2020
There are 795 colleges and universities in Japan as of 2020, according to the statistics of the Ministry of Education, Culture, Sports, Science and Technology.
The following shows the changes in the number of colleges/universities between 1955 and 2020.
Table: Number of Colleges/Universities, 1955-2020
| Total | National | Prefectural, Municipal | Private | |
| 1955 | 228 | 72 | 34 | 122 |
| 1960 | 245 | 72 | 33 | 140 |
| 1965 | 317 | 73 | 35 | 209 |
| 1970 | 382 | 75 | 33 | 274 |
| 1975 | 420 | 81 | 34 | 305 |
| 1980 | 446 | 93 | 34 | 319 |
| 1985 | 460 | 95 | 34 | 331 |
| 1990 | 507 | 96 | 39 | 372 |
| 1995 | 565 | 98 | 52 | 415 |
| 2000 | 649 | 99 | 72 | 478 |
| 2005 | 726 | 87 | 86 | 553 |
| 2010 | 778 | 86 | 95 | 597 |
| 2015 | 779 | 86 | 89 | 604 |
| 2016 | 777 | 86 | 91 | 600 |
| 2017 | 780 | 86 | 90 | 604 |
| 2018 | 782 | 86 | 93 | 603 |
| 2019 | 786 | 86 | 93 | 607 |
| 2020 | 795 | 86 | 94 | 615 |

The number of national colleges/universities has not changed much, and the number of private colleges/universities is increasing.
Source is Ministry of Education, Culture, Sports, Science and Technology.
www.mext.go.jp/b_menu/toukei/002/002b/1417059_00006.htm
Related Topics
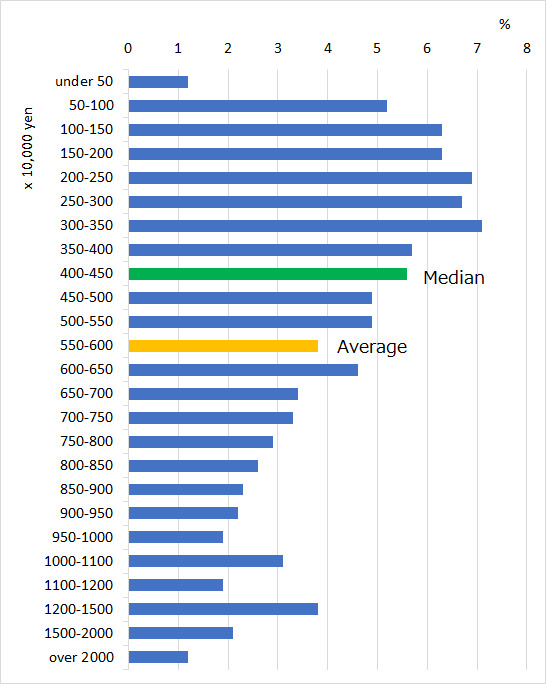
Distribution of Yearly Household Incomes in Japan, 2018
Ministry of Health, Labour and Welfare issued the result of National Livelihood Survey 2018. According to it, the average yearly income of Japanese household was 5,523,000 yen ($50,093 €42,527) in 2018. In 2016, the average household income was 5,602,000 yen. In fact, the value of income has gone down.
The median income was 4,370,000 yen ($39,635 €33,649). 61.1% of people live by the below average income.
In the survey, "income" includes taxes and social security charges. So the after-tax pay (take-home money) is less than "income".
The below shows the percentage distribution of yearly household incomes.
Table: Distribution of Yearly Household Income in Japan, 2018
| Household income (10,000 yen) | % |
| under 50 | 1.2 |
| 50-100 | 5.2 |
| 100-150 | 6.3 |
| 150-200 | 6.3 |
| 200-250 | 6.9 |
| 250-300 | 6.7 |
| 300-350 | 7.1 |
| 350-400 | 5.7 |
| 400-450 | 5.6 |
| 450-500 | 4.9 |
| 500-550 | 4.9 |
| 550-600 | 3.8 |
| 600-650 | 4.6 |
| 650-700 | 3.4 |
| 700-750 | 3.3 |
| 750-800 | 2.9 |
| 800-850 | 2.6 |
| 850-900 | 2.3 |
| 900-950 | 2.2 |
| 950-1000 | 1.9 |
| 1000-1100 | 3.1 |
| 1100-1200 | 1.9 |
| 1200-1500 | 3.8 |
| 1500-2000 | 2.1 |
| over 2000 | 1.2 |
Source is Ministry of Health, Labour and Welfare. 2019年 国民生活基礎調査の概況
www.mhlw.go.jp/toukei/saikin/hw/k-tyosa/k-tyosa19/index.html
www.e-stat.go.jp/stat-search/file-download?statInfId=000031957828&fileKind=1
Related Topics