Tokyo is getting warmer slightly??? Average Temperature & Atmospheric Pressure in Tokyo, 1989-2011
The following table shows average temperature and sea level average atmospheric pressure in Tokyo, from 1989 to 2011. In terms of 2011, I added monthly data.
| Year | Average atmospheric pressure (sea level) | Average Temperature | Average highs | Average lows |
| hPa | ℃ | ℃ | ℃ | |
| 1989 | 1014.5 | 16.4 | 19.9 | 13.2 |
| 1990 | 1014.8 | 17.0 | 20.6 | 13.8 |
| 1991 | 1013.6 | 16.4 | 19.8 | 13.2 |
| 1992 | 1014.1 | 16.0 | 19.6 | 12.7 |
| 1993 | 1013.9 | 15.5 | 19.0 | 12.3 |
| 1994 | 1013.8 | 16.9 | 20.5 | 13.5 |
| 1995 | 1013.2 | 16.3 | 20.1 | 13.0 |
| 1996 | 1013.9 | 15.8 | 19.7 | 12.3 |
| 1997 | 1013.7 | 16.7 | 20.6 | 13.2 |
| 1998 | 1014.6 | 16.7 | 20.5 | 13.4 |
| 1999 | 1013.6 | 17.0 | 20.9 | 13.6 |
| 2000 | 1013.4 | 16.9 | 20.6 | 13.6 |
| 2001 | 1013.3 | 16.5 | 20.4 | 13.1 |
| 2002 | 1013.4 | 16.7 | 20.5 | 13.4 |
| 2003 | 1014.4 | 16.0 | 19.6 | 12.8 |
| 2004 | 1014.3 | 17.3 | 21.3 | 13.9 |
| 2005 | 1012.8 | 16.2 | 20.0 | 12.8 |
| 2006 | 1013.8 | 16.4 | 19.9 | 13.4 |
| 2007 | 1013.6 | 17.0 | 20.7 | 13.7 |
| 2008 | 1014.0 | 16.4 | 20.1 | 13.3 |
| 2009 | 1013.3 | 16.7 | 20.2 | 13.6 |
| 2010 | 1014.1 | 16.9 | 20.7 | 13.6 |
| 2011 | 1014.0 | 16.5 | 20.3 | 13.1 |
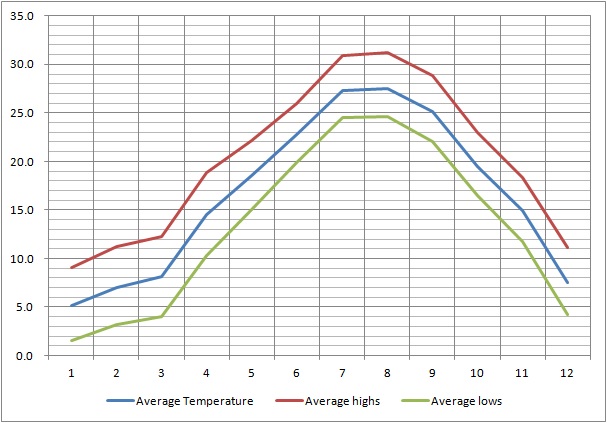
| Jan. | 1013.6 | 5.1 | 9.1 | 1.5 |
| Feb. | 1018.1 | 7.0 | 11.2 | 3.2 |
| Mar. | 1015.0 | 8.1 | 12.3 | 4.0 |
| Apr. | 1013.3 | 14.5 | 18.9 | 10.3 |
| May | 1011.8 | 18.5 | 22.2 | 15.0 |
| June | 1009.6 | 22.8 | 26.0 | 19.9 |
| July | 1008.6 | 27.3 | 30.9 | 24.5 |
| Aug. | 1010.6 | 27.5 | 31.2 | 24.6 |
| Sept. | 1011.9 | 25.1 | 28.8 | 22.0 |
| Oct. | 1017.9 | 19.5 | 23.0 | 16.5 |
| Nov. | 1019.7 | 14.9 | 18.3 | 11.7 |
| Dec. | 1017.8 | 7.5 | 11.1 | 4.2 |
Graph: Yearly mean temperature in Tokyo (unit: ℃)

Red line is the approximated curve. It seems the temperature in Tokyo is getting warmer slightly.
Graph: Monthly mean temperature in Tokyo (2011, unit: ℃)

Graph: Monthly average atmospheric pressure in Tokyo (2011, unit: hPa)

Source : Tokyo District Meteorological Observatory
Related Topics