30 Most Rented Foreign Movies in First Half of 2021 in Japan
The TSUTAYA rental chain has counted the top 30 foreign movies in its chain between January 2021 and June 2021. According to the chain, the most rented movie was TENET.
The following list shows the top 30.
No. 1
TENET
")
No. 2
Frozen II
")
No. 3
Star Wars: The Rise Of Skywalker
 (字幕版)")
No. 4
Wonder Woman 1984
")
No. 5
Rambo: Last Blood
")
No. 6
Midway
")
No. 7
SKYFIRE
")
No. 8
Dolittle
")
No. 9
Peninsula
")
No. 10
The Witches
")
No. 11
ANИA
")
No. 12
The Wolf's Call
")
No. 13
Breach (Anti-Life)
")
No. 14
47 Meters Down: Uncaged
")
No. 15
The Invisible Man
")
No. 16
The Addams Family
![アダムス・ファミリー ブルーレイ+DVD [Blu-ray]](https://m.media-amazon.com/images/I/51k8xSWe4lL._SL500_.jpg "アダムス・ファミリー ブルーレイ+DVD [Blu-ray]")
No. 17
THE SERPENT
")
No. 18
Archive
")
No. 19
IP MAN 4
")
No. 20
JIU JITSU
")
No. 21
Hitman: Agent Jun
")
No. 22
Toy Story 4
")
No. 23
Mortal
")
No. 24
Unparalleled Mulan
")
No. 25
Search and Destroy
")
No. 26
The Divine Fury
")
No. 27
Great White
")
No. 28
Escape from Pretoria
")
No. 29
Parasite
")
No. 30
Matchless Mulan
")
The source is Tsutaya.
tsutaya.tsite.jp/news/store/41575402/
Related Topics
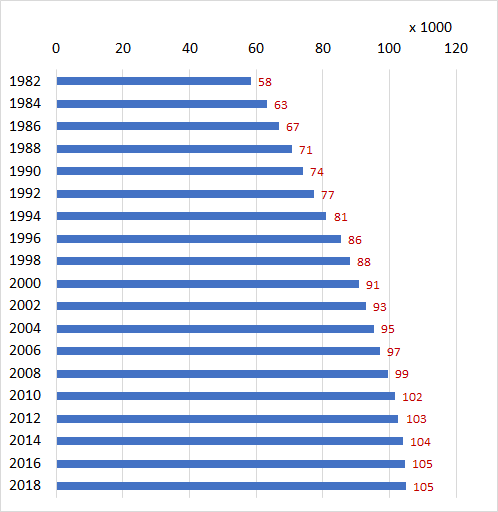
Changes in the Number of Dentists in Japan, 1982-2018
The following data shows the changes in the number of dentist in Japan between 1982 and 2018.
| Year | Dentists | Rate of change(%) | per 100,000 population |
| 1982 | 58,362 | … | 49.2 |
| 1984 | 63,145 | 8.2 | 52.5 |
| 1986 | 66,797 | 5.8 | 54.9 |
| 1988 | 70,572 | 5.7 | 57.5 |
| 1990 | 74,028 | 4.9 | 59.9 |
| 1992 | 77,416 | 4.6 | 62.2 |
| 1994 | 81,055 | 4.7 | 64.8 |
| 1996 | 85,518 | 5.5 | 67.9 |
| 1998 | 88,061 | 3.0 | 69.6 |
| 2000 | 90,857 | 3.2 | 71.6 |
| 2002 | 92,874 | 2.2 | 72.9 |
| 2004 | 95,197 | 2.5 | 74.6 |
| 2006 | 97,198 | 2.1 | 76.1 |
| 2008 | 99,426 | 2.3 | 77.9 |
| 2010 | 101,576 | 2.2 | 79.3 |
| 2012 | 102,551 | 1.0 | 80.4 |
| 2014 | 103,972 | 1.4 | 81.8 |
| 2016 | 104,533 | 0.5 | 82.4 |
| 2018 | 104,908 | 0.4 | 83.0 |
Source is Ministry of Health, Labour and Welfare. 平成30年(2018年)医師・歯科医師・薬剤師統計の概況
www.mhlw.go.jp/toukei/saikin/hw/ishi/18/index.html
www.mhlw.go.jp/toukei/saikin/hw/ishi/18/xls/hyo_H30.xls
Related Topics
Number of Pharmacists in Japan, 2018
According to Ministry of Health, Labour and Welfare, 311,289 of pharmacists are regstered in Japan as of 2018.
The follwong data shows the changes in the number of pharmacists from 1982 to 2018.
| Year | Pharmacists | Rate of change (%) |
per 100,000 population |
| 1982 | 124,390 | … | 104.8 |
| 1984 | 129,700 | 4.3 | 107.9 |
| 1986 | 135,990 | 4.8 | 111.8 |
| 1988 | 143,429 | 5.5 | 116.8 |
| 1990 | 150,627 | 5.0 | 121.9 |
| 1992 | 162,021 | 7.6 | 130.2 |
| 1994 | 176,871 | 9.2 | 141.5 |
| 1996 | 194,300 | 9.9 | 154.4 |
| 1998 | 205,953 | 6.0 | 162.8 |
| 2000 | 217,477 | 5.6 | 171.3 |
| 2002 | 229,744 | 5.6 | 180.3 |
| 2004 | 241,369 | 5.1 | 189.0 |
| 2006 | 252,533 | 4.6 | 197.6 |
| 2008 | 267,751 | 6.0 | 209.7 |
| 2010 | 276,517 | 3.3 | 215.9 |
| 2012 | 280,052 | 1.3 | 219.6 |
| 2014 | 288,151 | 2.9 | 226.7 |
| 2016 | 301,323 | 4.6 | 237.4 |
| 2018 | 311,289 | 3.3 | 246.2 |

The increasing rate of pharmacists is greater than doctors'.
Source is Ministry of Health, Labour and Welfare. 平成30年(2018年)医師・歯科医師・薬剤師統計の概況
www.mhlw.go.jp/toukei/saikin/hw/ishi/18/index.html
www.mhlw.go.jp/toukei/saikin/hw/ishi/18/xls/hyo_H30.xls
Related Topics