Changes in the Prices of Edible Oil in Japan, 1970-2014
Japanese government monitors the price of edible oil every month.
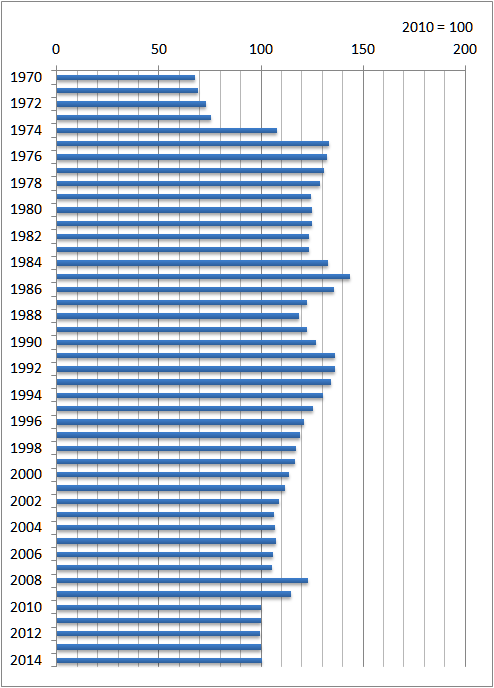
The following data show the changes in the price indexes of edible oil between 1970 and 2014, if the price in 2010 is taken as 100.

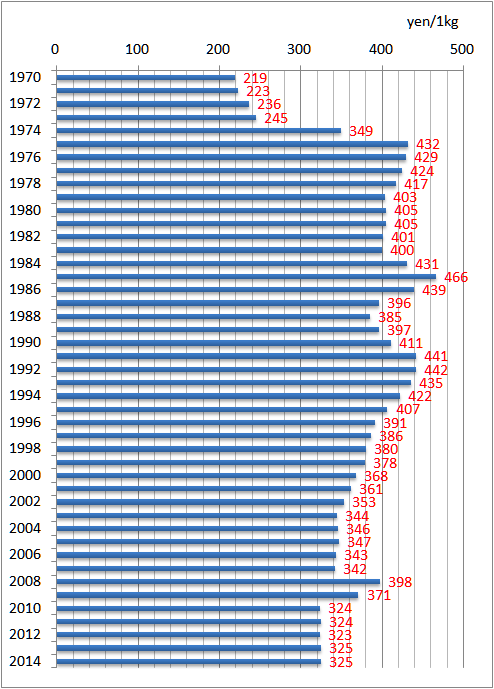
| Year | Index (2010 = 100) | Price of 1kg edible oil (yen) |
| 1970 | 67.7 | 219 |
| 1971 | 68.9 | 223 |
| 1972 | 72.8 | 236 |
| 1973 | 75.7 | 245 |
| 1974 | 107.7 | 349 |
| 1975 | 133.2 | 432 |
| 1976 | 132.5 | 429 |
| 1977 | 131.0 | 424 |
| 1978 | 128.7 | 417 |
| 1979 | 124.4 | 403 |
| 1980 | 125.0 | 405 |
| 1981 | 125.1 | 405 |
| 1982 | 123.7 | 401 |
| 1983 | 123.4 | 400 |
| 1984 | 132.9 | 431 |
| 1985 | 143.8 | 466 |
| 1986 | 135.6 | 439 |
| 1987 | 122.3 | 396 |
| 1988 | 118.8 | 385 |
| 1989 | 122.4 | 397 |
| 1990 | 126.7 | 411 |
| 1991 | 136.2 | 441 |
| 1992 | 136.3 | 442 |
| 1993 | 134.4 | 435 |
| 1994 | 130.3 | 422 |
| 1995 | 125.5 | 407 |
| 1996 | 120.8 | 391 |
| 1997 | 119.1 | 386 |
| 1998 | 117.3 | 380 |
| 1999 | 116.8 | 378 |
| 2000 | 113.7 | 368 |
| 2001 | 111.5 | 361 |
| 2002 | 108.9 | 353 |
| 2003 | 106.3 | 344 |
| 2004 | 106.8 | 346 |
| 2005 | 107.1 | 347 |
| 2006 | 105.9 | 343 |
| 2007 | 105.6 | 342 |
| 2008 | 122.8 | 398 |
| 2009 | 114.5 | 371 |
| 2010 | 100.0 | 324 |
| 2011 | 100.1 | 324 |
| 2012 | 99.7 | 323 |
| 2013 | 100.2 | 325 |
| 2014 | 100.3 | 325 |
The next data show the changes in 1kg edible oil price from 1970 to 2014.

Source is Statistics Bureau. 消費者物価指数 (CPI) 結果
www.stat.go.jp/data/cpi/historic.htm
www.e-stat.go.jp/SG1/estat/Csvdl.do?sinfid=000011288549
Related Topics