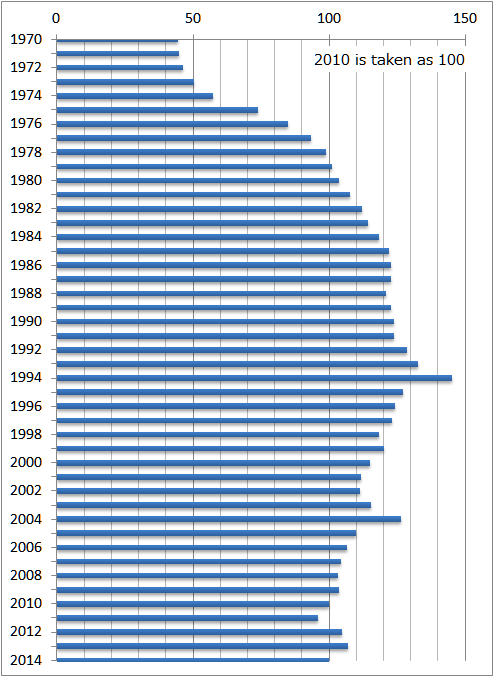
Changes in the Prices of Rice in Japan, 1970-2014
Japanese government researches the prices of goods in the market every month. In order to calculate the Consumer Price Index, the government computes the price indexes of goods. The following shows the changes in the price indexes of rice between 1970 and 2014, if the price in 2010 is taken as 100.
1993 was a lean year of rice crop. The price was high temporarily. 2003 was also a lean year.

| Year | Index (2010 = 100) | Price of 5kg rice (yen) |
| 1970 | 44.6 | 1080 |
| 1971 | 44.8 | 1085 |
| 1972 | 46.5 | 1126 |
| 1973 | 50.3 | 1218 |
| 1974 | 57.2 | 1385 |
| 1975 | 73.9 | 1790 |
| 1976 | 84.9 | 2056 |
| 1977 | 93.3 | 2260 |
| 1978 | 98.9 | 2395 |
| 1979 | 101.0 | 2446 |
| 1980 | 103.7 | 2512 |
| 1981 | 107.8 | 2611 |
| 1982 | 112.0 | 2713 |
| 1983 | 114.2 | 2766 |
| 1984 | 118.3 | 2865 |
| 1985 | 122.0 | 2955 |
| 1986 | 122.8 | 2974 |
| 1987 | 122.8 | 2974 |
| 1988 | 120.8 | 2926 |
| 1989 | 122.6 | 2969 |
| 1990 | 124.0 | 3003 |
| 1991 | 123.9 | 3001 |
| 1992 | 128.8 | 3120 |
| 1993 | 132.6 | 3212 |
| 1994 | 145.3 | 3519 |
| 1995 | 127.3 | 3083 |
| 1996 | 124.1 | 3006 |
| 1997 | 123.1 | 2981 |
| 1998 | 118.2 | 2863 |
| 1999 | 120.1 | 2909 |
| 2000 | 115.2 | 2790 |
| 2001 | 111.6 | 2703 |
| 2002 | 111.2 | 2693 |
| 2003 | 115.4 | 2795 |
| 2004 | 126.6 | 3066 |
| 2005 | 109.8 | 2659 |
| 2006 | 106.4 | 2577 |
| 2007 | 104.5 | 2531 |
| 2008 | 103.2 | 2500 |
| 2009 | 103.6 | 2509 |
| 2010 | 100.0 | 2422 |
| 2011 | 96.0 | 2325 |
| 2012 | 104.8 | 2538 |
| 2013 | 106.9 | 2589 |
| 2014 | 100.1 | 2424 |
Next graph presents the changes in the prices of 5kg rice.

Source is Statistics Bureau. 消費者物価指数 (CPI) 結果
www.stat.go.jp/data/cpi/historic.htm
www.e-stat.go.jp/SG1/estat/Csvdl.do?sinfid=000011288549
Related Topics