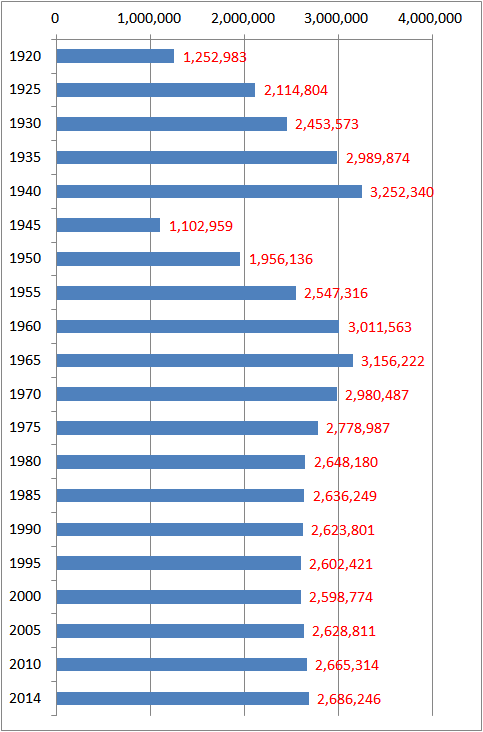
Changes in Population of Osaka City, 1920-2014
The following data show the changes in population of Osaka city, from 1920 to 2014.

| Year | Households | Population | Men | Women |
| 1920 | 276,347 | 1,252,983 | 673,648 | 579,335 |
| 1925 | 483,990 | 2,114,804 | 1,126,256 | 988,548 |
| 1930 | 541,033 | 2,453,573 | 1,303,862 | 1,149,711 |
| 1935 | 630,232 | 2,989,874 | 1,594,176 | 1,395,698 |
| 1940 | 725,730 | 3,252,340 | 1,691,176 | 1,561,164 |
| 1945 | 301,816 | 1,102,959 | 553,697 | 549,262 |
| 1950 | 471,208 | 1,956,136 | 975,547 | 980,589 |
| 1955 | 580,006 | 2,547,316 | 1,281,416 | 1,265,900 |
| 1960 | 735,525 | 3,011,563 | 1,542,833 | 1,468,730 |
| 1965 | 852,825 | 3,156,222 | 1,598,376 | 1,557,846 |
| 1970 | 891,966 | 2,980,487 | 1,490,779 | 1,489,708 |
| 1975 | 906,749 | 2,778,987 | 1,378,287 | 1,400,700 |
| 1980 | 938,541 | 2,648,180 | 1,304,599 | 1,343,581 |
| 1985 | 976,978 | 2,636,249 | 1,295,771 | 1,340,478 |
| 1990 | 1,050,560 | 2,623,801 | 1,292,747 | 1,331,054 |
| 1995 | 1,105,351 | 2,602,421 | 1,278,212 | 1,324,209 |
| 2000 | 1,169,621 | 2,598,774 | 1,273,121 | 1,325,653 |
| 2005 | 1,245,012 | 2,628,811 | 1,280,325 | 1,348,486 |
| 2010 | 1,317,990 | 2,665,314 | 1,293,798 | 1,371,516 |
| 2014 | 1,364,161 | 2,686,246 | 1,302,787 | 1,383,459 |
Source is City of Yokohama. 大都市比較統計年表 I 土地及び気象 ~ V 工業 [H26 ~]
www.city.yokohama.lg.jp/ex/stat/daitoshi/
www.city.yokohama.lg.jp/ex/stat/daitoshi/h26/data/h020100.xlsx
Related Topics