Changes in the Gender Ratio in Japan, 1920-2015
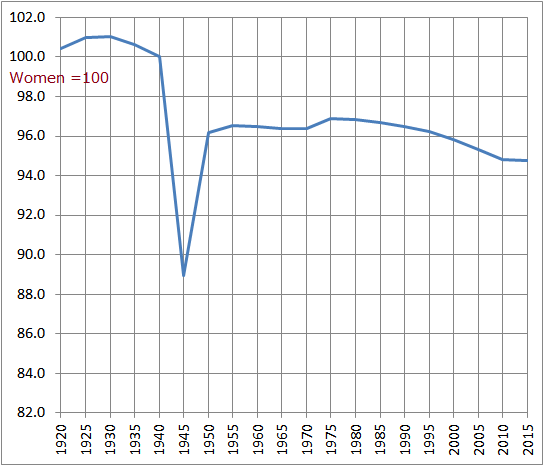
The following data show the changes in the gender ratio (if population of women = 100) in Japan, between 1920 and 2015.
Many men died in World War II, then the men's population was low in 1945.
Figure: Changes in Gender Ratio in Japan, 1920-2015

| Year | Gender ratio (women=100) |
| 1920 | 100.4 |
| 1925 | 101.0 |
| 1930 | 101.0 |
| 1935 | 100.6 |
| 1940 | 100.0 |
| 1945 | 89.0 |
| 1950 | 96.2 |
| 1955 | 96.5 |
| 1960 | 96.5 |
| 1965 | 96.4 |
| 1970 | 96.4 |
| 1975 | 96.9 |
| 1980 | 96.9 |
| 1985 | 96.7 |
| 1990 | 96.5 |
| 1995 | 96.2 |
| 2000 | 95.8 |
| 2005 | 95.3 |
| 2010 | 94.8 |
| 2015 | 94.8 |
Source is Statistics Bureau.
www.e-stat.go.jp/SG1/estat/GL08020101.do?_toGL08020101_&tstatCode=000001011777&requestSender=search
www.e-stat.go.jp/SG1/estat/GL08020103.do?_xlsDownload_&fileId=000007822259&releaseCount=3
Related Topics