Ikebukuro may be going to vanish by 2100, because of population decreasing, Shinjuku is relatively safe.
A private organization Japan Policy Council brought out their study in May about the issue of population decreasing in Japan. They calculated the estimated population in 2040 and the decreasing rate of the young women's population by 2040. They warned that if the decreasing rate of the young women population is higher than 50% in a community, it is very hard to sustain the community in terms of reproduction. The community might vanish, even if they raise their birth rate to very high level. They warned that 896 municipalities (49.8% of all of municipalities) might vanish in the future.
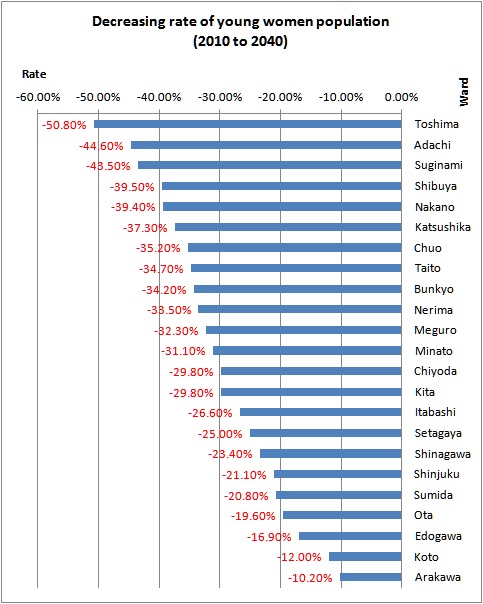
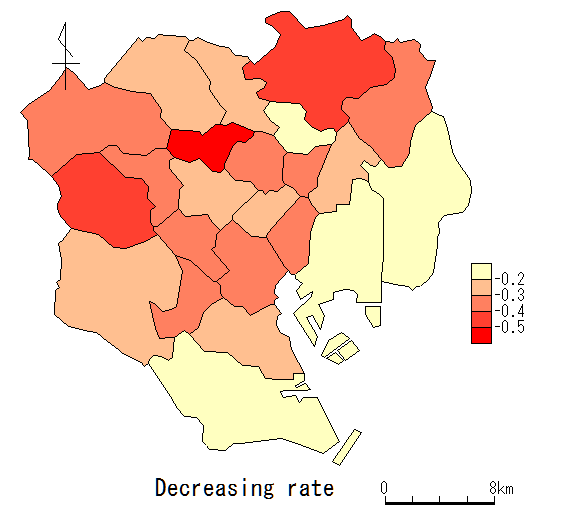
Most of the vulnerable communities are located in the countryside. But there is one vulnerable municipality in Tokyo 23 wards. It is Toshima ward where Ikebukuro is located. Japan Policy Council estimated the young women population in Toshima is going to decrease by 50.8% until 2040. It is a very high figure. In cases of Shibuya and Shinjuku, those are 39.5%, 21.1% respectively.
Toshima ward local office has a critical feeling about this warning and created a task force to deal with this issue.
Figure: Decreasing rate of the young women population (2010 to 2040) in Tokyo 23 wards

Table: Young women population (2010 to 2040) in Tokyo 23 wards
| 2010 population | 2010 population Age 20-39 women | 2040 population | 2040 population Age 20-39 women | Decreasing rate of young women (2010 to 2040) | |
| Toshima | 284,678 | 50,136 | 272,688 | 24,666 | -50.80% |
| Adachi | 683,426 | 90,107 | 520,662 | 49,931 | -44.60% |
| Suginami | 549,569 | 85,802 | 468,653 | 48,466 | -43.50% |
| Shibuya | 204,492 | 36,240 | 179,551 | 21,943 | -39.50% |
| Nakano | 314,750 | 54,943 | 276,692 | 33,300 | -39.40% |
| Katsushika | 442,586 | 57,839 | 351,079 | 36,254 | -37.30% |
| Chuo | 122,762 | 23,298 | 149,588 | 15,088 | -35.20% |
| Taito | 175,928 | 23,841 | 167,939 | 15,567 | -34.70% |
| Bunkyo | 206,626 | 35,171 | 205,420 | 23,153 | -34.20% |
| Nerima | 716,124 | 105,657 | 759,489 | 70,245 | -33.50% |
| Meguro | 268,330 | 47,355 | 248,890 | 32,040 | -32.30% |
| Minato | 205,131 | 36,320 | 229,946 | 25,016 | -31.10% |
| Chiyoda | 47,115 | 7,234 | 48,030 | 5,076 | -29.80% |
| Kita | 335,544 | 48,109 | 295,263 | 33,794 | -29.80% |
| Itabashi | 535,824 | 79,050 | 507,834 | 58,041 | -26.60% |
| Setagaya | 877,138 | 149,574 | 891,877 | 112,151 | -25.00% |
| Shinagawa | 365,302 | 60,346 | 378,746 | 46,211 | -23.40% |
| Shinjuku | 326,309 | 58,427 | 359,658 | 46,078 | -21.10% |
| Sumida | 247,606 | 36,997 | 268,452 | 29,301 | -20.80% |
| Ota | 693,373 | 102,156 | 690,762 | 82,147 | -19.60% |
| Edogawa | 678,967 | 97,994 | 661,973 | 81,428 | -16.90% |
| Koto | 460,819 | 69,021 | 543,970 | 60,758 | -12.00% |
| Arakawa | 203,296 | 29,857 | 218,307 | 26,801 | -10.20% |

Source is Japan Policy Council.
www.policycouncil.jp/
www.policycouncil.jp/pdf/prop03/prop03_2_1.xlsx
Related Topics