Salt and Sugar Consumption in Japan
The following chart shows daily salt consumption per capita in Japan from 2003 to 2012. Unit is gram. Men eat more salt than women. Salt consumption is gradually decreasing.
Ministry of Health, Labour and Welfare recommends to reduce salt consumption to prevent high blood pressure.

Source is Ministry of Health, Labour and Welfare.
www.mhlw.go.jp/stf/houdou/0000032074.html
www.mhlw.go.jp/file/04-Houdouhappyou-10904750-Kenkoukyoku-Gantaisakukenkouzoushinka/0000032813.pdf
----------
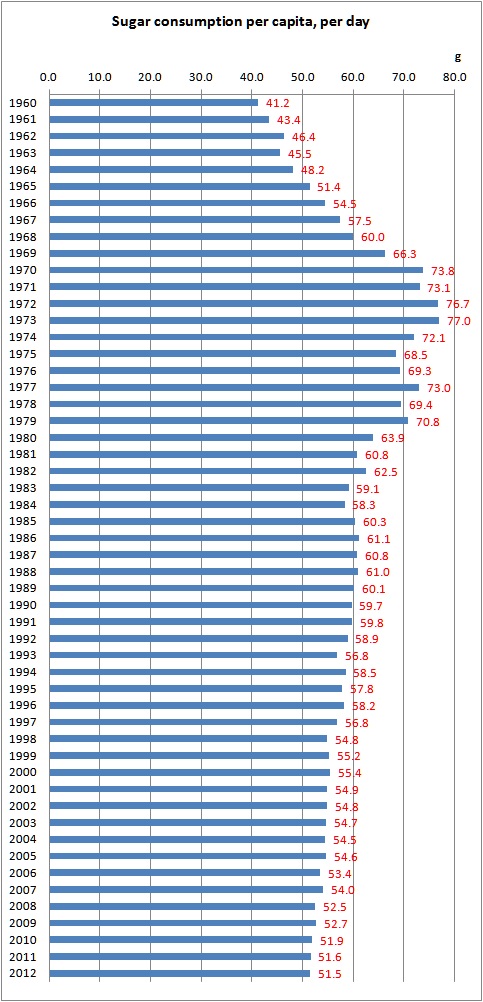
The next graph describes daily sugar consumption per capita from 1960 to 2012. Unit is gram. Sugar consumption is also decreasing year by year.

Source is Ministry of Agriculture, Forestry and Fisheries.
www.maff.go.jp/j/tokei/kouhyou/zyukyu/index.html
www.e-stat.go.jp/SG1/estat/Xlsdl.do?sinfid=000023624742
----------
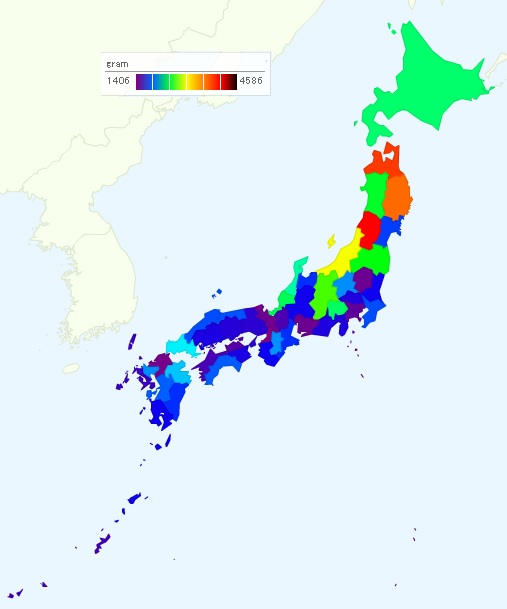
The table below presents salt consumption by city. It is the average yearly consumption from 2011 to 2013. Unit is gram.
| City | Salt consumption (g) |
| Average | 2,248 |
| Yamagata | 4,586 |
| Aomori | 4,202 |
| Morioka | 4,016 |
| Niigata | 3,210 |
| Nagano | 2,895 |
| Fukushima | 2,747 |
| Akita | 2,695 |
| Fukui | 2,615 |
| Kofu | 2,595 |
| Sapporo | 2,578 |
| Kanazawa | 2,476 |
| Yamaguchi | 2,292 |
| Oita | 2,213 |
| Nara | 2,119 |
| Maebashi | 2,114 |
| Saga | 2,114 |
| Kumamoto | 2,029 |
| Kochi | 2,025 |
| Tottori | 2,006 |
| Matsue | 1,999 |
| Chiba | 1,997 |
| Sendai | 1,970 |
| Toyama | 1,943 |
| Miyazaki | 1,941 |
| Tsu | 1,941 |
| Sakai | 1,911 |
| Hamamatsu | 1,882 |
| Wakayama | 1,817 |
| Kagoshima | 1,813 |
| Mito | 1,807 |
| Gifu | 1,797 |
| Tokushima | 1,769 |
| Hiroshima | 1,762 |
| Shizuoka | 1,749 |
| Saitama | 1,743 |
| Okayama | 1,724 |
| Kobe | 1,704 |
| Nagasaki | 1,660 |
| Naha | 1,619 |
| Matsuyama | 1,597 |
| Otsu | 1,588 |
| Kawasaki | 1,581 |
| Kitakyushu | 1,579 |
| Takamatsu | 1,552 |
| Yokohama | 1,523 |
| Tokyo | 1,504 |
| Utsunomiya | 1,477 |
| Nagoya | 1,470 |
| Kyoto | 1,459 |
| Fukuoka | 1,439 |
| Osaka | 1,406 |

People in northern Japan buy salt much. Osaka is the last place. It is said people in Kansei area (Osaka, Kyoto, Kobe) like bland foods.
Source is Statistics Bureau, Ministry of Internal Affairs and Communications.
www.stat.go.jp/data/kakei/zuhyou/rank08.xls
www.stat.go.jp/data/kakei/5.htm
----------
Next table shows sugar consumption by city in Japan. It is the average yearly consumption from 2011 to 2013 (unit is gram).
| City | Sugar consumption (g) |
| Average | 6,296 |
| Wakayama | 8,106 |
| Matsue | 7,807 |
| Miyazaki | 7,606 |
| Nagasaki | 7,037 |
| Sakai | 6,956 |
| Yamagata | 6,918 |
| Nagano | 6,866 |
| Tottori | 6,767 |
| Akita | 6,760 |
| Oita | 6,747 |
| Kitakyushu | 6,481 |
| Matsuyama | 6,455 |
| Shizuoka | 6,411 |
| Saga | 6,316 |
| Kobe | 6,196 |
| Hamamatsu | 6,177 |
| Kagoshima | 6,150 |
| Okayama | 6,053 |
| Tsu | 6,023 |
| Kumamoto | 5,977 |
| Kochi | 5,883 |
| Sapporo | 5,859 |
| Niigata | 5,848 |
| Aomori | 5,816 |
| Nara | 5,767 |
| Chiba | 5,720 |
| Tokushima | 5,673 |
| Nagoya | 5,647 |
| Mito | 5,606 |
| Takamatsu | 5,606 |
| Osaka | 5,596 |
| Yamaguchi | 5,578 |
| Gifu | 5,570 |
| Kyoto | 5,526 |
| Kofu | 5,432 |
| Otsu | 5,397 |
| Hiroshima | 5,369 |
| Sendai | 5,081 |
| Yokohama | 5,048 |
| Toyama | 5,039 |
| Kanazawa | 4,994 |
| Utsunomiya | 4,901 |
| Fukushima | 4,829 |
| Fukuoka | 4,762 |
| Morioka | 4,704 |
| Naha | 4,631 |
| Fukui | 4,629 |
| Maebashi | 4,536 |
| Saitama | 4,414 |
| Kawasaki | 4,176 |
| Tokyo | 4,071 |

Tokyo is the last place.
Source is Statistics Bureau, Ministry of Internal Affairs and Communications.
www.stat.go.jp/data/kakei/zuhyou/rank08.xls
www.stat.go.jp/data/kakei/5.htm
Related Topics