Changes in Population of Saitama City, 1920-2014
The following data show the changes in population of Saitama city, from 1920 to 2014.

| Year | Households | Population | Men | Women |
| 1920 | 6,936 | 37,246 | 17,826 | 19,420 |
| 1925 | 9,689 | 50,349 | 24,712 | 25,637 |
| 1930 | 12,482 | 62,623 | 30,961 | 31,662 |
| 1935 | 17,540 | 88,588 | 43,904 | 44,684 |
| 1940 | 22,396 | 113,584 | 57,120 | 56,464 |
| 1945 | … | 194,382 | 93,005 | 101,377 |
| 1950 | 52,185 | 244,184 | 120,802 | 123,382 |
| 1955 | 67,968 | 322,746 | 160,418 | 162,328 |
| 1960 | 86,321 | 379,593 | 189,234 | 190,359 |
| 1965 | 122,836 | 488,729 | 246,499 | 242,230 |
| 1970 | 164,877 | 600,976 | 304,808 | 296,168 |
| 1975 | 212,359 | 729,887 | 369,946 | 359,941 |
| 1980 | 244,529 | 784,595 | 396,579 | 388,016 |
| 1985 | 261,328 | 821,854 | 414,353 | 407,501 |
| 1990 | 307,007 | 901,107 | 456,352 | 444,755 |
| 1995 | 350,864 | 968,999 | 490,452 | 478,547 |
| 2000 | 388,303 | 1,024,053 | 516,877 | 507,176 |
| 2005 | 460,457 | 1,176,314 | 590,972 | 585,342 |
| 2010 | 503,126 | 1,222,434 | 611,236 | 611,198 |
| 2014 | 526,117 | 1,251,549 | 624,235 | 627,314 |
Source is City of Yokohama. 大都市比較統計年表 I 土地及び気象 ~ V 工業 [H26 ~]
www.city.yokohama.lg.jp/ex/stat/daitoshi/
www.city.yokohama.lg.jp/ex/stat/daitoshi/h26/data/h020100.xlsx
Related Topics
Changes in Population of Sendai, 1920-2014
The following data show the changes in population of Sendai city, from 1920 to 2014. Sendai is the provincial capital of Tohoku region.

| Year | Households | Population | Men | Women |
| 1920 | 21,915 | 118,984 | 62,532 | 56,452 |
| 1925 | 26,814 | 142,894 | 73,679 | 69,215 |
| 1930 | 35,237 | 190,180 | 96,604 | 93,576 |
| 1935 | 39,883 | 219,547 | 110,466 | 109,081 |
| 1940 | 41,659 | 223,630 | 109,505 | 114,125 |
| 1945 | 47,422 | 238,250 | 114,481 | 123,769 |
| 1950 | 67,261 | 341,685 | 175,341 | 166,344 |
| 1955 | 78,636 | 375,844 | 185,349 | 190,495 |
| 1960 | 102,798 | 425,272 | 209,960 | 215,312 |
| 1965 | 129,275 | 480,925 | 237,675 | 243,250 |
| 1970 | 163,301 | 545,065 | 270,298 | 274,767 |
| 1975 | 200,455 | 615,473 | 305,172 | 310,301 |
| 1980 | 236,638 | 664,868 | 330,698 | 334,170 |
| 1985 | 255,739 | 700,254 | 349,009 | 351,245 |
| 1990 | 340,904 | 918,398 | 454,954 | 463,444 |
| 1995 | 387,292 | 971,297 | 480,684 | 490,613 |
| 2000 | 421,182 | 1,008,130 | 496,270 | 511,860 |
| 2005 | 439,579 | 1,025,098 | 500,597 | 524,501 |
| 2010 | 465,260 | 1,045,986 | 507,833 | 538,153 |
| 2014 | 491,423 | 1,073,242 | 522,282 | 550,960 |
Source is City of Yokohama. 大都市比較統計年表 I 土地及び気象 ~ V 工業 [H26 ~]
www.city.yokohama.lg.jp/ex/stat/daitoshi/
www.city.yokohama.lg.jp/ex/stat/daitoshi/h26/data/h020100.xlsx
Related Topics
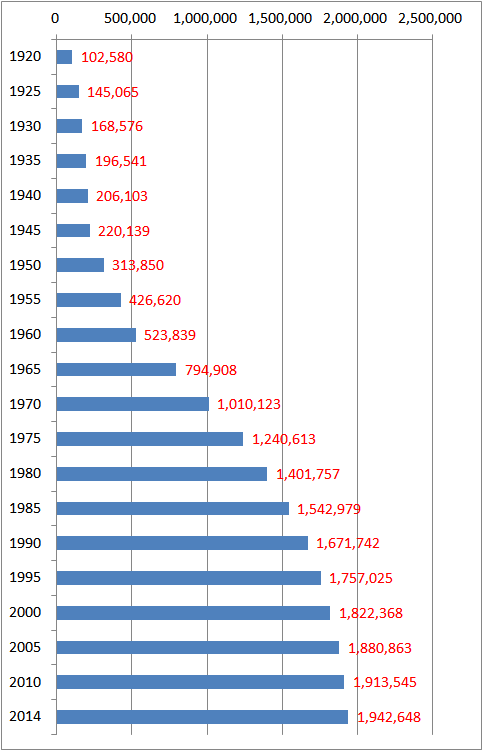
Changes in Population of Sapporo, 1920-2014
The following data show the changes in population of Sapporo city, from 1920 to 2014. Sapporo is the biggest city in Hokkaido island.

| Year | Households | Population | Men | Women |
| 1920 | 20,041 | 102,580 | 53,018 | 49,562 |
| 1925 | 28,726 | 145,065 | 73,980 | 71,085 |
| 1930 | 32,752 | 168,576 | 85,509 | 83,067 |
| 1935 | 38,019 | 196,541 | 98,150 | 98,391 |
| 1940 | 40,602 | 206,103 | 102,112 | 103,991 |
| 1945 | 45,899 | 220,139 | 105,954 | 114,185 |
| 1950 | 67,492 | 313,850 | 156,290 | 157,560 |
| 1955 | 90,764 | 426,620 | 214,941 | 211,679 |
| 1960 | 135,783 | 523,839 | 264,367 | 259,472 |
| 1965 | 224,681 | 794,908 | 400,145 | 394,763 |
| 1970 | 312,234 | 1,010,123 | 503,157 | 506,966 |
| 1975 | 419,475 | 1,240,613 | 614,533 | 626,080 |
| 1980 | 508,823 | 1,401,757 | 691,057 | 710,700 |
| 1985 | 566,287 | 1,542,979 | 753,216 | 789,763 |
| 1990 | 646,647 | 1,671,742 | 809,185 | 862,557 |
| 1995 | 718,473 | 1,757,025 | 843,170 | 913,855 |
| 2000 | 781,948 | 1,822,368 | 868,883 | 953,485 |
| 2005 | 837,367 | 1,880,863 | 889,054 | 991,809 |
| 2010 | 885,848 | 1,913,545 | 896,850 | 1,016,695 |
| 2014 | 932,974 | 1,942,648 | 906,109 | 1,036,539 |
Source is City of Yokohama. 大都市比較統計年表 I 土地及び気象 ~ V 工業 [H26 ~]
www.city.yokohama.lg.jp/ex/stat/daitoshi/
www.city.yokohama.lg.jp/ex/stat/daitoshi/h26/data/h020100.xlsx
Related Topics